
The MACD True Alerts indicator for MT5 is a powerful momentum and trend-following tool designed to identify changes in market direction, strength, and momentum.
Based on the traditional Moving Average Convergence Divergence calculation, the indicator analyzes the relationship between fast and slow moving averages to highlight potential trading opportunities.
This enhanced version includes a dedicated signal line and automatic alerts, making it easier to detect important MACD events without constantly monitoring the indicator window.
It provides visual signals when momentum changes and helps identify possible entry and exit points during trending market conditions.
The indicator can be applied to different trading strategies, including trend following, breakout confirmation, and momentum-based setups.
Why traders use the MACD True Alerts Indicator
The MACD remains one of the most widely used momentum indicators because it combines trend direction and market strength in one calculation.
However, reading MACD crossovers manually can become challenging when monitoring multiple charts or fast-moving markets.
The MACD True Alerts Indicator simplifies the process by automatically highlighting important crossover signals and providing alerts when momentum conditions change.
The additional signal line helps create a smoother view of market direction and makes it easier to identify possible trend transitions.
The histogram also provides valuable momentum information.
When histogram bars expand, it suggests increasing buying or selling pressure.
When the bars become smaller, momentum may be weakening and a possible market shift could be developing.
Download This MT5 Indicator for Free
Indicator Chart Setup
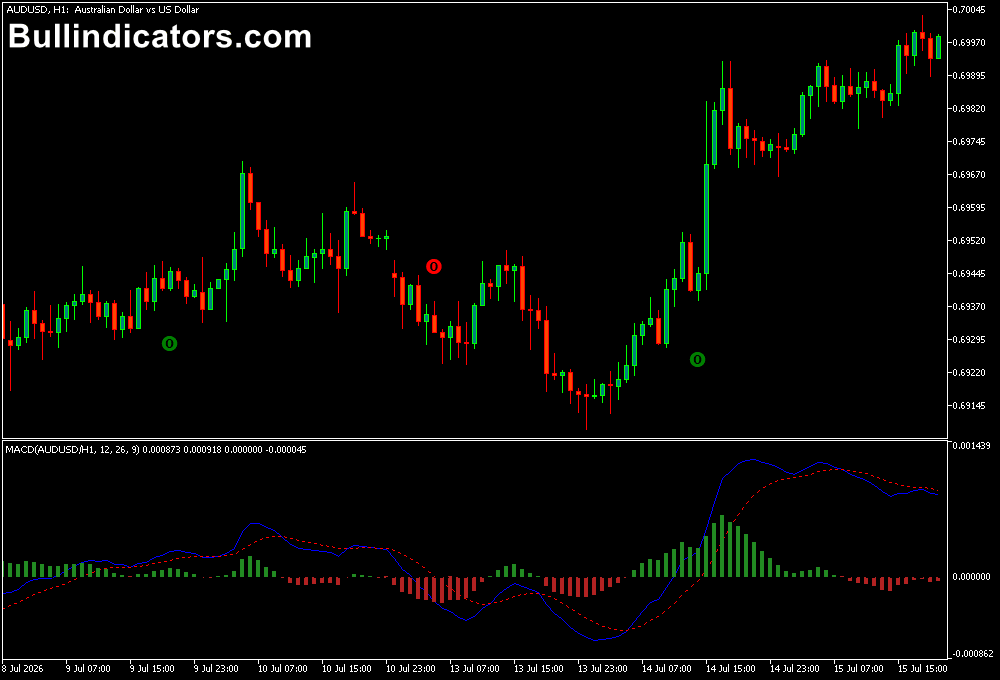
After installing the MACD True Alerts Indicator on an MT5 chart, the indicator appears in a separate window below the price chart.
It displays the MACD line, signal line, and histogram to visualize momentum changes.
A bullish green signal appears when the faster MACD line crosses above the slower line, indicating that buying momentum is increasing.
A red bearish signal occurs when the faster line moves below the slower line, suggesting growing selling pressure.
The indicator can also generate alerts when these conditions occur, allowing you to receive notifications through push alerts, email, sound, or on-chart messages.
Core Features
- Classic MACD calculation with improved signal interpretation
- Additional signal line for trend analysis
- Automatic bullish and bearish crossover detection
- Momentum histogram display
- Multiple alert options
- Customizable indicator appearance
Best for
- Identifying momentum changes
- Confirming trend direction
- Finding potential entry and exit points
- Filtering weak market conditions
- Supporting breakout strategies
Best Markets
- EUR/USD, GBP/USD, USD/JPY
- GBP/JPY and other volatile Forex pairs
- Gold (XAU/USD)
- NAS100, US30, and major indices
- Stocks with strong directional movement
- Major cryptocurrency markets
Trading Styles
- Trend following strategies
- Momentum trading
- Intraday market analysis
- Scalping trading setups
- Breakout confirmation methods
- Multi-timeframe trading approaches
How traders use it
The MACD True Alerts Indicator is commonly used to confirm whether market momentum supports a potential trade setup.
A crossover alone should not always be considered a complete trading signal.
The surrounding market conditions, trend direction, and important price levels should also be evaluated.
One effective method is combining the MACD True Alerts Indicator with the Banks Levels Indicator for MT5.
The Banks Levels tool identifies important institutional price zones, while MACD confirms whether momentum is supporting a possible move.
For example, if EUR/USD declines toward a banking support level identified by the Banks Levels Indicator, the next step is to monitor the MACD True Alerts signal.
If price creates a bullish rejection candle near support and the MACD line crosses above the signal line with increasing histogram strength, this creates a potential long setup.
A stop loss can be positioned below the banking support zone, while the next resistance level can be used as a possible profit target.
The same approach can be applied to short positions.
If price reaches a banking resistance level and MACD confirms weakening momentum with a bearish crossover, this may indicate that sellers are becoming active.
A short entry can be considered after confirmation, with the stop loss placed above the resistance area.
The combination is also useful for breakout strategies.
When price closes strongly beyond a banking level and MACD confirms increasing momentum, the move may have stronger continuation potential.
Waiting for a retest of the broken level can help avoid entering during false breakouts.
Get Instant Free Access
Indicator Settings
- Fast MA Period: Controls the faster moving average calculation. Lower values make the indicator react quicker to price changes, while higher values create smoother signals.
- Slow MA Period: Defines the slower moving average used in the MACD calculation. Increasing this value creates a broader trend perspective.
- Signal MA Period: Adjusts the smoothing period of the signal line. Lower values create faster crossover signals, while higher values reduce signal frequency.
- Colors: Allows customization of MACD lines, histogram bars, and signal markers.
- Push Alert: Sends notifications to your mobile device when a new signal appears.
- Alert on Chart: Displays signal notifications directly on the MT5 trading chart.
- Sound Alert: Activates an audio notification when a MACD event occurs.
Important Notes
- MACD signals work best when aligned with the broader market trend.
- Sideways markets can produce weaker crossover signals.
- Combining momentum analysis with support and resistance can improve trade selection.
- Higher timeframe signals usually contain less market noise.
- Always apply proper risk management when using momentum indicators.









