
The Pivot Points All In One indicator for MT4 is a complete support and resistance tool that automatically calculates important market levels directly on the chart.
Pivot points are widely used by Forex traders to identify potential reversal zones, breakout areas, and possible locations for stop loss and take profit placement.
This indicator combines several popular pivot calculation methods, including Classic, Woodie, Fibonacci, Camarilla, and Central Pivot Range (CPR).
By having multiple approaches available in one tool, traders can select the calculation method that best matches their trading style and market analysis.
Pivot levels are especially useful because they provide predefined areas where price may react.
When combined with price action and trend analysis, the indicator can help traders plan trades with better structure.
Why traders use the Pivot Points All In One Indicator for MT4
Support and resistance levels are important reference points in technical analysis.
Manually calculating and drawing pivot levels every trading session can take time, especially when monitoring multiple markets.
The Pivot Points All In One Indicator automatically performs these calculations and displays the levels on the MT4 chart.
The indicator gives traders access to different pivot methods within a single tool.
Classic pivots are widely followed for daily support and resistance, Fibonacci pivots can help identify correction zones, Camarilla levels are popular among intraday traders, Woodie pivots place more importance on closing prices, and CPR levels help analyze market direction.
These levels can be used to locate potential entries, define profit targets, and identify areas where price may slow down or reverse.
Download This MT4 Indicator for Free
Indicator Chart Setup
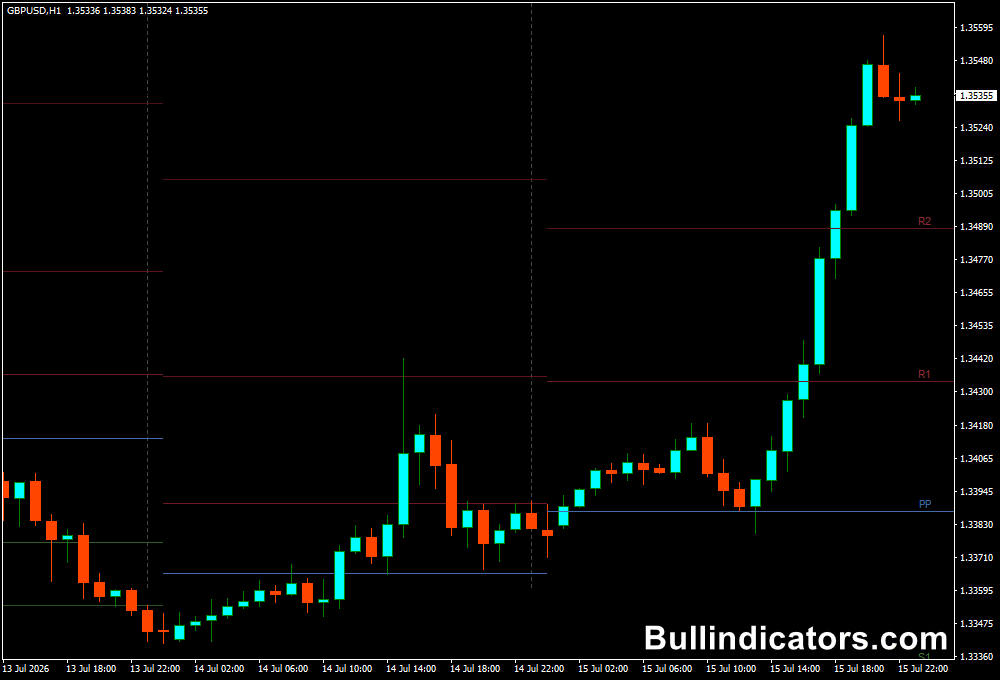
After applying the indicator to an MT4 chart, multiple horizontal pivot levels appear around the current price.
Depending on the selected calculation method, traders can see support levels (S1, S2, S3, and S4), resistance levels (R1, R2, R3, and R4), and central pivot areas.
The displayed levels act as possible reaction zones where buyers and sellers may become more active.
Traders can adjust the number of visible levels and the calculation timeframe according to their preferred strategy.
Core Features
- Includes Classic, Woodie, Fibonacci, Camarilla, and CPR pivot methods.
- Automatically calculates support and resistance levels.
- Displays multiple pivot levels on the MT4 chart.
- Useful for entries, exits, and trade management.
- Adjustable calculation timeframe.
- Customizable number of displayed levels.
- Suitable for intraday and longer-term analysis.
- Works with multiple trading strategies.
Best for
- Identifying support and resistance zones.
- Planning entry and exit areas.
- Setting stop loss and take profit levels.
- Analyzing daily market direction.
- Finding possible reversal and breakout areas.
Best Markets
- Major Forex pairs where daily pivot levels are widely followed.
- Gold (XAUUSD) and other commodities with strong intraday reactions.
- Indices that often respect previous session levels.
- Currency futures and CFDs with clear trading sessions.
- Markets where traders rely on previous highs, lows, and closing prices.
Trading Styles
- Scalping on M5 and M15 charts using Camarilla or tighter pivot levels.
- Intraday trading on M15, M30, and H1 charts using daily pivot zones.
- Swing trading on H4 charts by monitoring larger support and resistance areas.
- Position trading on Daily and Weekly charts using major pivot levels.
- Breakout strategies where traders monitor price movement beyond key pivot zones.
How traders use it
The Pivot Points All In One Indicator is commonly used as a market map.
Traders first identify the important support and resistance levels and then wait for price action to show how the market reacts around these areas.
For example, when price approaches a support level and shows signs of buying pressure, traders may look for long opportunities.
If price reaches a resistance level and struggles to continue higher, it may provide a potential area to consider taking profits or looking for reversal setups.
The indicator can also assist with trend continuation trades.
When price breaks through an important pivot level with strong momentum, traders may monitor whether the breakout continues toward the next support or resistance zone.
Different pivot methods suit different market conditions.
Intraday traders may prefer closer levels for shorter moves, while swing traders often focus on wider levels from higher timeframe calculations.
Get Instant Free Access
Indicator Settings
- Calculation Method/Period: Selects the pivot calculation method and timeframe used for displaying levels.
- Available Timeframes to Display: Allows selection of periods from Daily to Monthly calculations.
- Show Only Recent Period: Controls whether short, standard, or extended historical levels are displayed.
- Depth of Levels (show up to): Selects the number of support and resistance levels shown, from S1/R1 up to S4/R4.
- Number of Periods to Show: Determines how many previous pivot periods remain visible on the chart.
Important Notes
- Pivot levels are reference areas, not guaranteed reversal points.
- Different calculation methods may produce different price levels.
- Higher timeframe pivot levels generally receive more attention from traders.
- Combine pivot analysis with price action and market conditions.
- Adjust the settings depending on your trading timeframe and strategy.
- Always use proper risk management when trading around support and resistance levels.









