
The Donchian Channel indicator for MT4 is a popular trend-following tool designed to identify market direction, breakout opportunities, and potential continuation setups.
It is based on the highest highs and lowest lows over a selected period, creating a dynamic channel around price movement.
This indicator helps traders recognize when a new trend may be developing and provides a visual representation of market volatility.
During strong price movements, the channel expands, while quieter market conditions create a narrower channel.
The Donchian Channel is widely used in breakout strategies, trend-following systems, and automated trading solutions.
It can be applied to different markets and timeframes, making it suitable for short-term setups as well as longer-term trend analysis.
Why traders use Donchian Channel Indicator
Many market participants rely on the Donchian Channel because it provides a simple way to understand price momentum and trend strength.
The upper and lower channel boundaries highlight important breakout areas where buying or selling pressure may increase.
When price moves beyond the upper channel, it can indicate growing bullish momentum.
A break below the lower channel may signal increasing bearish pressure.
These signals allow traders to participate in emerging trends rather than entering after a large part of the move has already occurred.
The indicator is also valuable for identifying pullback opportunities.
During established trends, price often returns toward the channel before continuing in the original direction, creating possible re-entry setups.
Download This MT4 Indicator for Free
Indicator Chart Setup
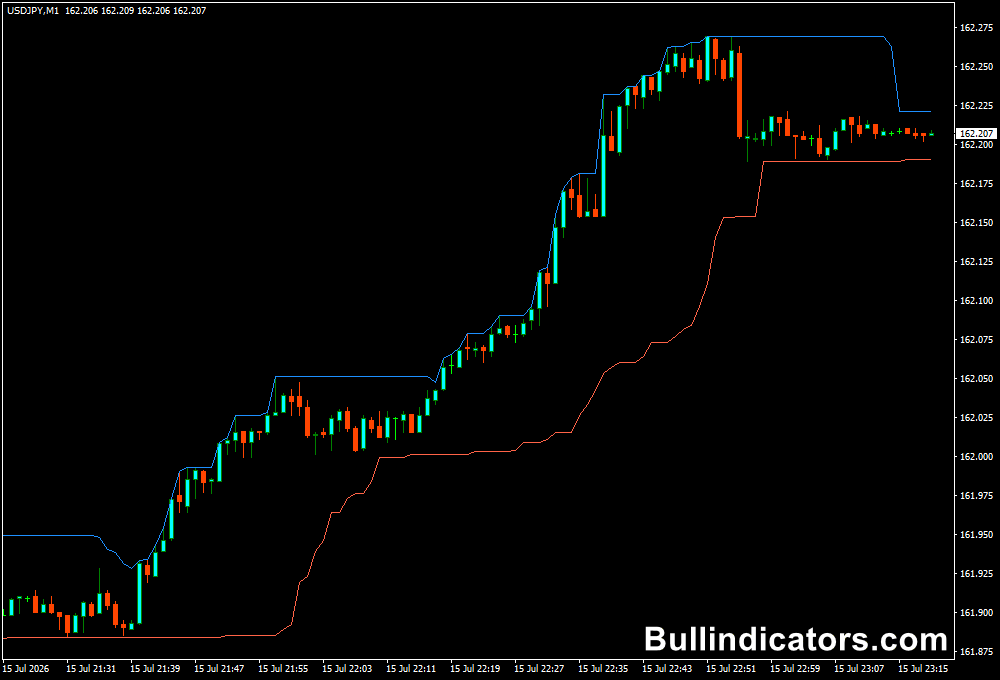
After installing the Donchian Channel Indicator on a MetaTrader 4 chart, a channel appears around price action based on the selected calculation period.
The upper line represents the highest price level reached, while the lower line marks the lowest price level during that period.
The direction and angle of the channel provide information about the current market trend.
A rising channel suggests bullish conditions, while a declining channel indicates bearish momentum.
When the channel moves sideways, it often reflects a ranging market with limited directional strength.
The indicator can be used on any timeframe, allowing users to analyze long-term trends or search for shorter-term breakout opportunities.
Core Features
- Identifies potential trend beginnings and breakout points
- Displays dynamic upper and lower price channels
- Measures changes in market volatility
- Highlights possible pullback entry opportunities
- Works across different timeframes and markets
- Suitable for manual trading and automated systems
Best for
- Finding breakout trading opportunities
- Following established market trends
- Identifying continuation setups during pullbacks
- Analyzing volatility expansion and contraction
- Building trend-based trading strategies
Best Markets
- Major forex pairs such as EUR/USD, GBP/USD, and USD/JPY
- Trending pairs like GBP/JPY with strong directional movements
- Gold (XAU/USD) during periods of increased volatility
- Stock indices such as NASDAQ and DAX for breakout strategies
- Cryptocurrency markets where strong trends frequently develop
Trading Styles
- Trend following using H1, H4, and daily charts
- Breakout trading around channel boundaries
- Swing trading based on major market movements
- Scalping during high-volume breakout periods
- Multi-timeframe analysis for trend confirmation
How traders use it
A common approach with the Donchian Channel Indicator is to enter when price breaks above or below the channel.
A move above the upper boundary may provide a bullish setup, while a drop below the lower boundary can indicate a potential bearish opportunity.
Risk management is usually based on the opposite side of the channel or recent market structure.
For example, a buy position after an upper channel breakout may use the lower channel area as a reference for stop-loss placement.
Experienced users often combine multiple timeframes.
A higher timeframe chart can reveal the main trend direction, while a lower timeframe chart helps refine entries and exits.
This approach can reduce false signals during sideways market conditions.
The indicator can also support pyramiding strategies, where additional positions are added during pullbacks while the main trend remains intact.
Get Instant Free Access
Indicator Settings
- Periods: Defines the calculation period used to create the Donchian Channel.
- Colors: Allows customization of the channel appearance.
- Styling: Adjusts the visual format of the displayed channel lines.
Important Notes
- The indicator works best when combined with trend confirmation and proper risk management.
- Breakout signals can produce false entries during ranging market conditions.
- The selected period affects how quickly the channel reacts to price changes.
- Different assets may require different settings due to their unique volatility characteristics.
- Past price ranges do not always represent future market behavior, so additional analysis is recommended.









