
The Heiken Ashi indicator for MT4 is a popular charting tool that helps simplify price action by creating smoother candlestick formations.
Traditional Japanese candlesticks provide valuable information about market movement, but frequent color changes can sometimes make trend identification more difficult during volatile periods.
The Heiken Ashi method reduces some of this market noise by calculating candle values differently from standard candlesticks.
The result is a cleaner view of trend direction, allowing users to identify stronger movements and potential changes in momentum more easily.
This indicator is widely used for trend-following strategies, especially when the goal is to remain in a position during extended market movements rather than reacting to every small price fluctuation.
Why traders use Heiken Ashi Indicator
The main advantage of the Heiken Ashi Indicator is its ability to present price movement in a smoother format.
Standard candlesticks can switch between bullish and bearish colors frequently during consolidation phases, creating uncertainty about the actual market direction.
Heiken Ashi candles often maintain the same color for longer periods, making trends easier to recognize.
Green candles typically represent bullish conditions, while red candles indicate bearish momentum.
Many users apply this indicator to identify when a trend is strengthening, weakening, or potentially reversing.
The candle structure can also help determine whether a current position should be maintained or whether market conditions are changing.
Download This MT4 Indicator for Free
Indicator Chart Setup
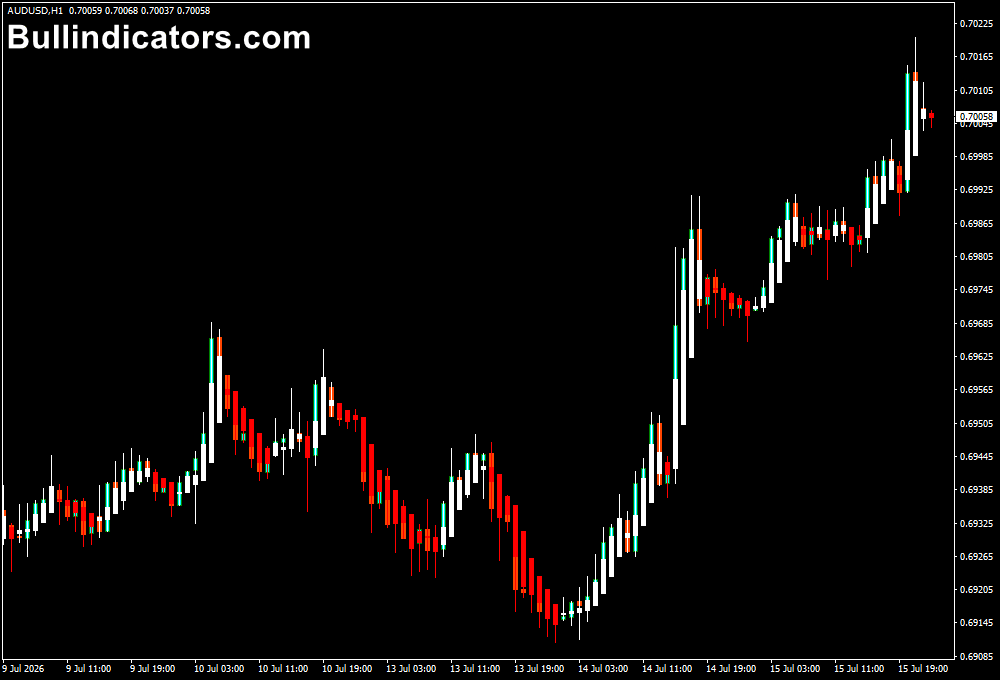
After attaching the Heiken Ashi Indicator to a MetaTrader 4 chart, the standard price candles are replaced with smoother Heiken Ashi candles.
These candles are calculated using average price values, creating a different visual representation of market movement.
During an uptrend, candles usually appear green and continue in the same direction. During a downtrend, candles generally remain red.
This makes it easier to identify sustained market phases compared with traditional candlestick charts.
The wicks of Heiken Ashi candles also provide useful information.
Strong bullish movements often show candles with little or no lower wick, while strong bearish movements may appear with limited or no upper wick.
Core Features
- Creates smoother candlestick charts for easier trend analysis
- Helps filter short-term market noise
- Highlights bullish and bearish market phases
- Shows possible trend weakening and reversal areas
- Useful for swing and position trading strategies
- Works across different forex pairs and timeframes
Best for
- Identifying longer-lasting market trends
- Following momentum-based trading strategies
- Reducing emotional reactions to small price movements
- Analyzing trend strength through candle structure
- Managing existing positions during strong trends
Best Markets
- Major forex pairs such as EUR/USD, GBP/USD, and USD/JPY
- Trending pairs like GBP/JPY with strong directional movements
- Gold (XAU/USD) during extended bullish or bearish phases
- Stock indices such as NASDAQ and DAX
- Commodities and markets with clear trend cycles
Trading Styles
- Swing trading using H4 and daily trend analysis
- Position trading for longer market movements
- Trend-following strategies based on candle color changes
- Momentum trading with additional confirmation tools
- Multi-timeframe trend analysis
How traders use it
A common method is using the Heiken Ashi candle color to determine market direction.
When candles turn green after a bearish phase, it may indicate improving bullish momentum.
When candles change from green to red, it can suggest that sellers are gaining control.
For example, a user following a bullish trend may remain in a position while green Heiken Ashi candles continue to appear.
If candles become smaller or change color, this may signal that momentum is weakening and a review of the position is needed.
The candle wicks can also provide additional insight.
Strong bullish trends often contain green candles without lower shadows, showing that buyers are maintaining control.
Strong bearish trends may display red candles without upper shadows.
Many market participants combine Heiken Ashi with other technical tools such as moving averages, support and resistance, or momentum indicators to improve confirmation.
Get Instant Free Access
Indicator Settings
- Colors: Allows customization of bullish and bearish candle colors.
- Line Style: Adjusts the visual style of indicator elements on the chart.
Important Notes
- Heiken Ashi candles are calculated differently from traditional candlesticks and may not show exact market prices.
- The indicator reacts more slowly than standard candles because it smooths price movement.
- It is more suitable for trend identification than short-term scalping.
- False signals can still occur during sideways market conditions.
- Combining the indicator with additional analysis can improve overall decision-making.









