
The Zone indicator for MT4 is a technical analysis tool that automatically identifies important support and resistance areas on the trading chart.
These zones represent price levels where buying or selling pressure may increase, creating possible reaction points for future market movements.
Finding strong zones manually requires experience and regular chart analysis.
The indicator simplifies this process by scanning market behavior and displaying potential areas where price may slow down, reverse, or continue moving.
The Zone Indicator can be used by both new and experienced market participants.
Beginners can use it to understand how support and resistance work, while advanced users can save time by having important price zones automatically plotted.
Why traders use Zone Indicator
Support and resistance analysis is one of the most widely used methods in technical trading.
Price often reacts around previous areas where buyers or sellers have shown strong interest, making these zones valuable for planning trades.
The Zone Indicator helps users locate these areas without manually drawing levels across multiple charts.
The displayed zones provide a quick overview of possible market reaction points and can help prepare entry and exit scenarios.
Green zones highlight potential support areas where buyers may become active, while red zones indicate possible resistance areas where selling pressure may appear.
The indicator becomes even more effective when combined with price action confirmation.
For example, when price returns to a support zone and forms a bullish rejection candle, the setup may provide a stronger buying opportunity.
A similar approach can be used at resistance zones with bearish confirmation.
Download This MT4 Indicator for Free
Indicator Chart Setup
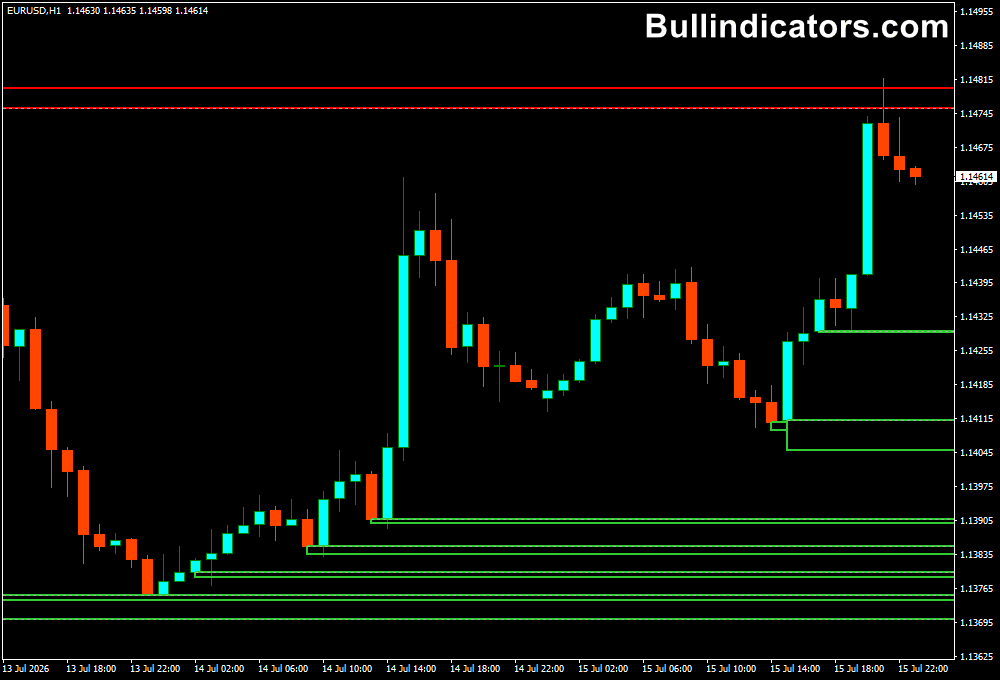
After attaching the Zone Indicator to a MetaTrader 4 chart, horizontal zones appear automatically around important price areas.
These zones are displayed as colored bars that represent possible support and resistance locations.
A green zone suggests an area where price may find buying interest, while a red zone highlights a possible selling area.
These levels can be used to monitor potential reversals, breakouts, and continuation opportunities.
The indicator can be applied to all timeframes, although higher timeframe charts such as H1, H4, and daily charts often provide stronger zones because they represent larger market movements.
Core Features
- Automatically detects potential support and resistance zones
- Displays important price areas directly on the MT4 chart
- Uses visual zones instead of single price lines
- Helps identify possible reversal and breakout areas
- Works with different trading styles and timeframes
- Can be combined with price action analysis
Best for
- Finding important market reaction areas
- Building support and resistance strategies
- Planning reversal entries with candle confirmation
- Identifying breakout levels
- Reducing time spent on manual chart analysis
Best Markets
- EUR/USD, GBP/USD, and USD/JPY for reliable forex zone analysis
- GBP/JPY and other volatile pairs with strong price reactions
- Gold (XAU/USD) where support and resistance zones are often respected
- Indices such as NASDAQ, DAX, and S&P 500
- Major cryptocurrency pairs with clear market swings
Trading Styles
- Price action trading around support and resistance zones
- Scalping using short-term reaction areas
- Day trading with M15, M30, and H1 setups
- Swing trading based on higher timeframe zones
- Trend trading using pullbacks into important levels
How traders use it
A popular method is waiting for price to return to one of the highlighted zones and then analyzing the reaction.
The zone itself does not create a trade signal; confirmation from price behavior is usually preferred.
For a buy setup, users typically wait for price to move into a green support zone.
If the market rejects the area with a bullish wick or a positive candlestick formation, a long position may be considered.
Stop loss placement is commonly below the support area or recent swing low.
For a sell setup, the process is reversed.
When price reaches a red resistance zone, traders look for signs of rejection such as bearish engulfing candles or upper wicks before considering a short position.
The indicator can also be used for breakout strategies.
If price breaks strongly through a zone, users may wait for a retest of that area before entering in the direction of the breakout.
Get Instant Free Access
Indicator Settings
- MA1: Displays the value of the first moving average used by the indicator.
- MA2: Displays the value of the second moving average calculation.
- Metod_MA: Selects the moving average calculation method.
- Price_MA: Defines which price value is used for the moving average calculation.
- Colors: Allows customization of support and resistance zone colors.
- Styling Options: Adjusts the visual appearance of indicator elements.
Important Notes
- Support and resistance zones are areas of interest, not guaranteed reversal points.
- Strong market momentum can cause price to break through important zones.
- Higher timeframe zones often provide stronger market context.
- Combining zones with candlestick confirmation can improve trade selection.
- Risk management should always be applied when trading from technical levels.









