
The Auto Support and Resistance indicator for MT4 automatically identifies and plots key support and resistance zones directly on the chart.
These levels are derived from market structure and fractal-based price extremes, helping traders quickly visualize where price has previously reacted.
Support zones are displayed in blue, while resistance zones appear in red, making it easy to distinguish potential buying and selling areas.
Why traders use the Auto Support and Resistance Indicator
Support and resistance analysis is a core concept in technical trading because price tends to react repeatedly at the same levels.
This indicator automates the process of detecting these zones, saving time and reducing the subjectivity involved in manual chart drawing.
Traders use support zones as potential buying areas where demand may increase, while resistance zones are viewed as areas where selling pressure may emerge.
These levels are useful for both breakout trading and range-bound strategies, depending on overall market conditions.
Download This MT4 Indicator for Free
Indicator Chart Setup
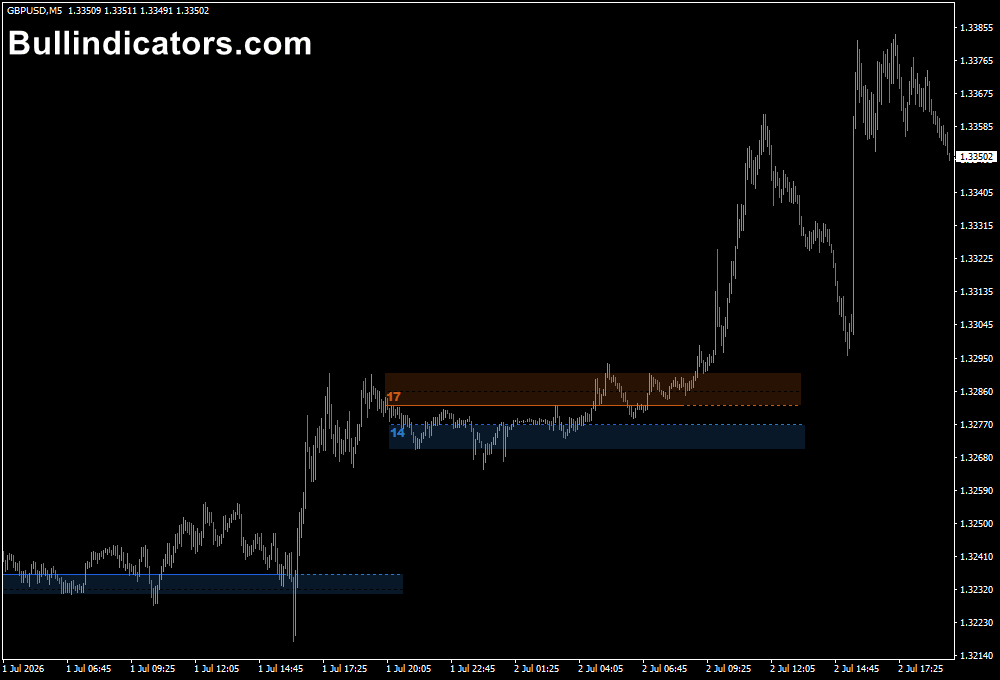
After applying the indicator to MT4, horizontal support and resistance zones appear across the chart based on fractal calculations and historical price extremes.
Resistance zones are highlighted in red, while support zones are marked in blue.
Each level varies in height and strength depending on the density and spacing of underlying fractals, giving traders insight into how significant each zone may be.
Core Features
- Automatically plots support and resistance zones
- Fractal-based market structure detection
- Color-coded support (blue) and resistance (red)
- Adjustable sensitivity and zone spacing
- Identifies breakout and reversal areas
- Works on all MT4 timeframes
Best for
- Identifying key market reaction levels
- Range trading strategies
- Breakout confirmation setups
- Trend continuation entries
- Setting stop-loss and take-profit zones
Best Markets
- Major Forex pairs
- Minor and cross currency pairs
- Gold (XAU/USD)
- Stock indices
- Commodity and CFD markets
Trading Styles
- Intraday trading
- Scalping (on lower timeframes)
- Day trading
- Swing trading
- Breakout trading
How traders use it
Traders often look for buying opportunities when price approaches a blue support zone and shows bullish confirmation through candles or momentum indicators.
Selling opportunities are considered near red resistance zones when bearish price action appears.
Breakout strategies are also common, where traders wait for price to break and retest a zone before entering in the direction of the breakout.
Example setup
A simple confirmation method can be combined with a basic moving average filter.
For example, when price is above a 50-period moving average and pulls back into a blue support zone, traders may look for bullish candlestick confirmation before entering a buy trade.
Conversely, when price is below the 50 MA and rejects a red resistance zone, sell setups may be considered.
This combination helps align zone-based trading with overall trend direction.
Get Instant Free Access
Indicator Settings
- Level Vertical Width: Adjusts the thickness of support and resistance zones.
- Levels Frequency on Chart: Controls how many zones appear on the chart.
- Breakout Sensitivity: Sets how responsive the indicator is to price breakouts.
- Levels Display Period: Defines the historical range used for zone calculation.
- Color Scheme: Customizes support and resistance visual appearance.
Important Notes
- Zones become more significant when multiple reactions occur at the same level.
- Breakouts are often stronger when aligned with the broader market trend.
- Lower timeframes produce more zones but also more noise.
- Higher timeframe zones typically carry more trading weight.
- Always confirm signals with price action before entering trades.









