
The Hull Moving Average indicator for MT4 is a fast and smooth trend analysis tool designed to identify short-term market direction.
Developed by Alan Hull, this moving average focuses more heavily on recent price action, allowing it to react faster than traditional Simple Moving Averages while maintaining smoother movement than many standard trend tools.
Because of its faster response to price changes, the HMA is widely used by short-term Forex participants who want to recognize developing trends earlier.
It can help identify bullish and bearish phases, locate potential pullback areas, and provide dynamic support and resistance levels on the chart.
The indicator works on all timeframes, but it is especially effective for intraday trading on M5, M15, and H1 charts where quick trend changes are important.
Why Use the Hull Moving Average Indicator
Traditional moving averages often suffer from delayed reactions because they rely heavily on historical price data.
The Hull Moving Average reduces this delay by giving more importance to recent market movements, creating a smoother line that follows price more closely.
This makes the HMA useful for identifying trend transitions and filtering market noise.
When price remains above the HMA, the market environment is generally considered bullish, while movement below the line suggests increasing bearish pressure.
The tool is also popular because it adapts well to different trading approaches.
Scalpers can use shorter settings for quick momentum changes, while swing traders can increase the period to follow larger market movements.
Download This MT4 Indicator for Free
Indicator Chart Setup
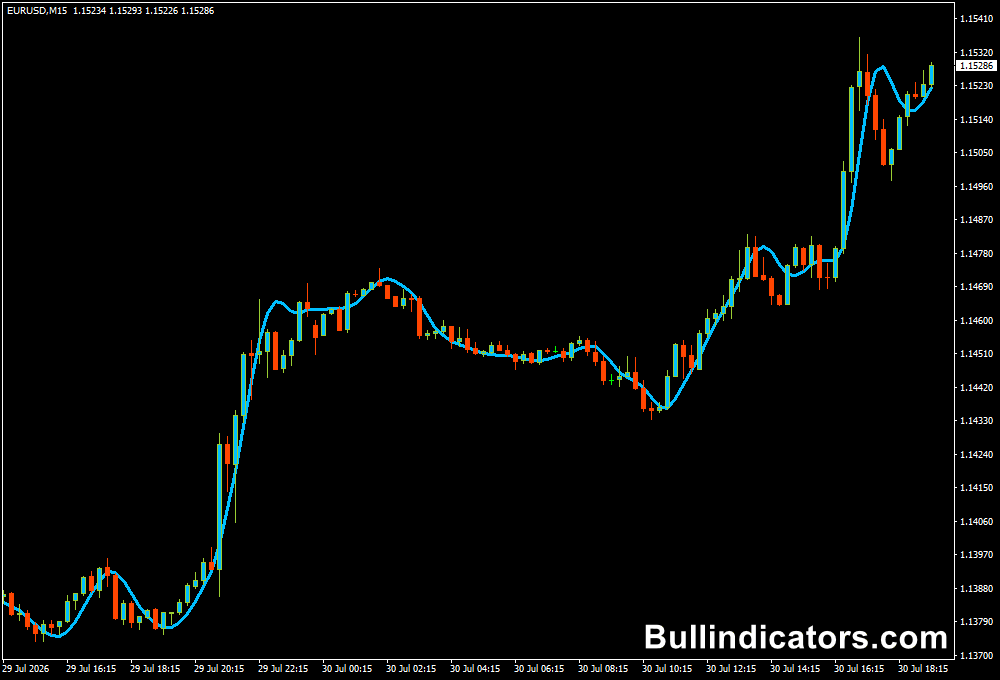
The Hull Moving Average is displayed directly over the price candles as a smooth moving average curve.
Its position changes with market direction, allowing you to quickly evaluate whether buyers or sellers currently have control.
A bullish condition develops when price trades above the HMA and respects the line as dynamic support.
A bearish environment appears when candles move below the HMA and the line acts as resistance.
The indicator can also be combined with another HMA using different periods to create a complete crossover strategy.
Core Features
- Fast reaction to recent price movements.
- Smoother than many traditional moving averages.
- Identifies short-term trend direction.
- Works on all MT4 timeframes.
- Can be used as dynamic support and resistance.
- Suitable for single-line analysis or HMA crossover systems.
Best For
- Short-term trend detection.
- Momentum trading.
- Moving average crossover strategies.
- Pullback entries.
- Intraday market analysis.
Best Markets
- EUR/USD on the M15 chart for identifying clean intraday trends.
- GBP/JPY on the M5 timeframe for fast momentum movements.
- USD/JPY on the H1 chart for following larger directional moves.
- XAU/USD (Gold) on M5 and M15 charts during strong volatility periods.
- EUR/AUD when looking for extended directional trends.
- US30 and NAS100 on lower timeframes where quick trend changes are common.
- Markets showing strong momentum where moving averages can clearly define direction.
Trading Styles
- Scalping.
- Day trading.
- Trend following.
- Momentum trading.
- Pullback trading.
- Moving average crossover systems.
How Traders Use It
The simplest approach is to monitor the relationship between price and the HMA line.
When candles move above the curve and continue holding above it, the market may be entering a bullish phase.
Many traders wait for a pullback toward the HMA before looking for a continuation entry.
For bearish conditions, the price should break below the moving average and remain underneath it.
A rejection from the HMA acting as resistance can provide additional confirmation before opening a short position.
HMA Crossover Strategy Example
A popular method is combining two Hull Moving Averages with different periods.
A shorter HMA reacts quickly to price changes, while a longer HMA provides the overall trend direction.
Buy Example: Add a fast HMA with a period of 20 and a slower HMA with a period of 50.
A bullish setup appears when the 20-period HMA crosses above the 50-period HMA.
For additional confirmation, wait until price remains above both lines before entering a buy trade.
A stop loss can be placed below the latest swing low, while profits can be managed using previous resistance levels or a fixed risk-to-reward ratio.
Sell Example: A bearish opportunity develops when the 20-period HMA crosses below the 50-period HMA.
Confirm that price is trading below both moving averages before opening a short position.
The stop loss can be placed above the most recent swing high, with the trade managed until the crossover reverses or the target is reached.
Get Instant Free Access
Indicator Settings
- Period – Defines the number of candles used in the HMA calculation. Lower values make the indicator react faster, while higher values create smoother trend signals.
- Shift – Adjusts the position of the moving average on the chart by moving it a selected number of bars.
- Method – Selects the calculation type used for the moving average, including Simple, Exponential, Smoothed, and Linear Weighted methods.
- Price – Determines which price data is used for the calculation, including Open, Close, High, Low, Median, Typical, and Weighted prices.
Important Notes
- The HMA reacts faster than many traditional moving averages.
- Best results are usually achieved in trending markets rather than sideways conditions.
- Lower periods provide faster signals but may create more market noise.
- Higher periods provide smoother signals for larger trend analysis.
- Combining the HMA with price action or another confirmation tool can improve trade selection.
- Always apply proper risk management when using moving average strategies.









