
The FX Multi Meter indicator for MT4 is a complete market analysis dashboard that combines several popular technical indicators into a single interface.
Rather than filling your chart with multiple oscillators and trend indicators, this tool gathers their values in one compact panel and calculates an overall BUY or SELL recommendation based on their combined output.
The dashboard makes it easy to evaluate market conditions within seconds.
It displays trend direction, momentum, moving average alignment, stochastic readings, MACD signals, PSAR direction, spread information, and multi-timeframe analysis in one location.
This saves valuable chart space while helping you quickly determine whether multiple technical tools agree with each other before entering a position.
Why Use the FX Multi Meter Indicator
Many trading systems rely on several confirmation indicators before opening a position.
Switching between different chart windows and indicator panels can become time-consuming, particularly when monitoring multiple currency pairs.
The FX Multi Meter simplifies this process by presenting everything in one organized dashboard.
One of its biggest strengths is confluence.
Rather than relying on a single signal, the final recommendation is generated from several well-known technical indicators.
When momentum, trend, moving averages, and oscillators point in the same direction, confidence in the setup generally increases.
This makes the dashboard useful for both identifying new opportunities and managing existing positions.
Download This MT4 Indicator for Free
Indicator Chart Setup
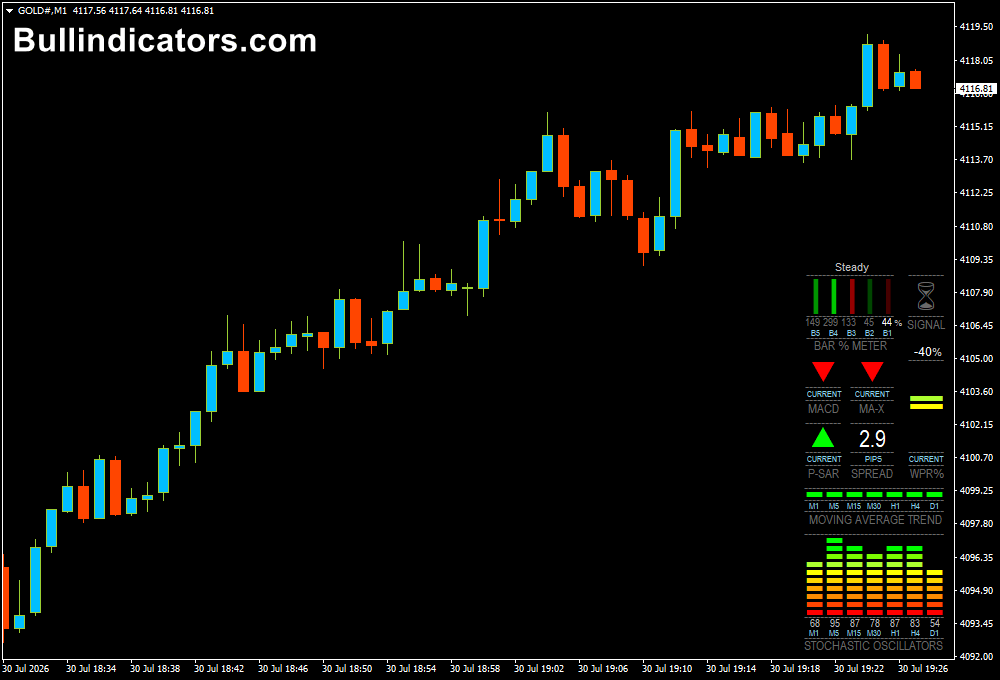
The FX Multi Meter appears as a compact dashboard on the trading chart without covering the candlesticks.
Every section represents a different technical study, allowing you to monitor trend direction, momentum, volatility, and market strength from a single location.
A final BUY or SELL recommendation is generated after evaluating the combined readings.
Because everything is displayed together, conflicting signals become immediately visible.
This makes it easier to avoid lower-quality setups where trend and momentum disagree.
Core Features
- Combines multiple technical indicators into one dashboard.
- Generates an overall BUY or SELL recommendation.
- Displays multi-timeframe trend analysis from M1 to D1.
- Includes MACD, Moving Averages, PSAR, Stochastic, Williams %R and Bar Meter.
- Shows the current spread of the selected trading instrument.
- Keeps the trading chart clean while providing comprehensive market information.
Best For
- Trend confirmation.
- Multi-indicator confluence.
- Multi-timeframe analysis.
- Trade management.
- Scanning multiple currency pairs.
Best Markets
- EUR/USD on the H1 chart for confirming higher-timeframe trend alignment before intraday entries.
- GBP/JPY on the M15 timeframe when momentum indicators and moving averages point in the same direction.
- AUD/USD during the Sydney and Tokyo sessions to monitor developing trends before London opens.
- USD/CAD on H1 around major Canadian or US economic releases to measure trend strength.
- XAU/USD on the M15 and H1 charts when combining momentum with multi-timeframe confirmation.
- US30 and NAS100 during the New York session to verify trend continuation across several technical tools.
- Scanning multiple Forex pairs to quickly identify markets where momentum, MACD, moving averages, and PSAR are aligned.
Trading Styles
- Scalping.
- Intraday trading.
- Swing trading.
- Trend following.
- Multi-timeframe trading.
- Technical confirmation strategies.
How Traders Use It
Many traders begin by looking at the overall BUY or SELL recommendation before examining the individual components of the dashboard.
The strongest opportunities usually occur when the MACD, moving averages, PSAR, stochastic oscillator, and Williams %R all support the same market direction.
For example, if the dashboard generates a BUY signal while the moving averages indicate an uptrend, the MACD is bullish, the stochastic is rising, and the PSAR sits below price, the probability of a continuation move generally increases.
If several components disagree, waiting for stronger alignment can help avoid unnecessary trades.
The dashboard is also valuable for managing open positions.
If momentum begins weakening while trend indicators remain bullish, it may be a signal to tighten stop losses or secure partial profits rather than immediately closing the position.
Get Instant Free Access
Indicator Settings
- Stoch_K – Defines the %K period used by the Stochastic Oscillator.
- Stoch_D – Sets the smoothing period for the stochastic signal line.
- Stoch_Slowing – Controls the slowing value to smooth stochastic movements.
- MA_Period – Specifies the moving average calculation period.
- MA_Shift – Moves the moving average forward or backward by the selected number of bars.
- MACD_Period1 – Fast moving average period for the MACD calculation.
- MACD_Period2 – Slow moving average period used by the MACD.
- MACD_Period3 – Signal line period for the MACD.
- FastLWMA – Period of the Linear Weighted Moving Average used in the MA-X calculation.
- SlowSMA – Period of the Simple Moving Average used for MA-X.
- PSAR_Step – Controls the acceleration step of the Parabolic SAR.
- PSAR_Max – Sets the maximum acceleration value of the Parabolic SAR.
Important Notes
- The dashboard combines several technical indicators into one interface.
- The strongest setups usually occur when most components point in the same direction.
- Suitable for every trading style from scalping to swing trading.
- Supports all MT4 brokers and financial instruments.
- Ideal for monitoring multiple charts without adding numerous indicators.
- Always combine dashboard signals with sound risk management before opening a position.









