
The Auto Channel indicator for MT4 is a technical analysis tool that automatically draws equidistant price channels on the MetaTrader 4 chart.
The indicator helps identify the current market direction by displaying the channel slope, while the upper and lower boundaries act as dynamic support and resistance areas.
Manually drawing accurate channels can be challenging because traders need to correctly identify swing points and maintain equal distance between channel lines.
This tool simplifies the process by automatically calculating the channel structure and projecting potential reaction zones.
By combining trend direction, channel boundaries, and price action analysis, the Auto Channel Indicator can help identify possible entry points with attractive risk-to-reward opportunities.
Why traders use the Auto Channel Indicator
Price channels are widely used because they provide a visual representation of market direction and trading ranges.
The Auto Channel Indicator makes this analysis faster by automatically identifying ascending and descending channels without requiring manual calculations.
The outer channel lines can act as potential support and resistance levels where price may react.
In an uptrend, the lower channel boundary can provide an area to search for buying opportunities, while the upper boundary may highlight possible profit targets.
The opposite applies during bearish channel movements.
Another advantage is that the indicator displays the channel slope, helping users quickly recognize whether the market environment is bullish or bearish.
This makes it useful for trend-following strategies as well as selected countertrend approaches.
Download This MT4 Indicator for Free
Indicator Chart Setup
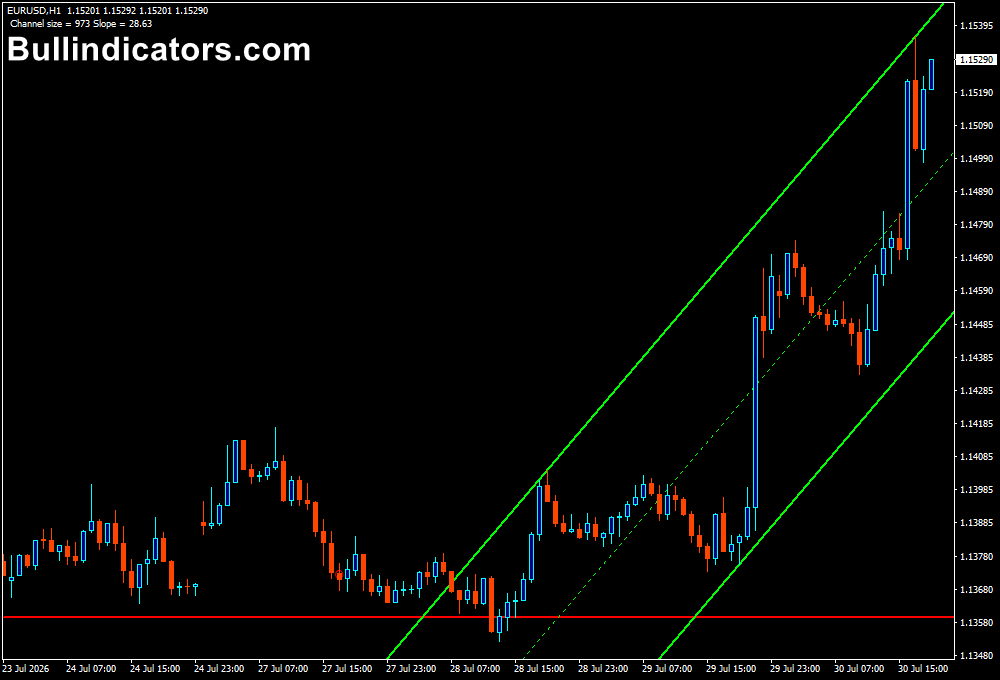
The chart display shows an automatically calculated price channel with upper, lower, and middle lines.
The outer channel boundaries highlight possible support and resistance areas, while the center line provides a reference point for the current price position.
The indicator also marks price interactions with the channel using visual signals.
When price reaches the outer boundaries, these areas can be monitored for possible continuation or reversal setups.
For example, an ascending channel suggests bullish market conditions.
A price pullback toward the lower channel line may offer a potential buying area if supported by bullish price action confirmation.
Core Features
- Automatically draws equidistant price channels
- Identifies bullish and bearish channel direction
- Provides dynamic support and resistance levels
- Displays channel slope information
- Highlights potential channel touch points
- Suitable for multiple trading timeframes
Best for
- Trading channel breakouts and reversals
- Finding entry zones during trending markets
- Identifying dynamic support and resistance areas
- Building price action trading strategies
- Analyzing market direction visually
Best Markets
- EUR/USD and GBP/USD where clean price channels frequently develop
- USD/CAD and other major pairs with steady directional moves
- Gold (XAU/USD) during strong trending periods
- Indices such as NAS100 and US30 with clear intraday channels
- Oil and commodity markets with extended price movements
Trading Styles
- Intraday trading using M15 and H1 channel setups
- Swing trading with H4 and Daily channels
- Trend-following strategies based on channel direction
- Countertrend trading from channel extremes
- Price action setups using reversal candle confirmation
How traders use it
The Auto Channel Indicator can be used to trade both continuation and reversal opportunities.
The most common approach is to follow the direction of the channel and look for entries near the outer boundaries.
For a bullish setup, traders can wait for price to reach the lower channel line while the channel slope remains positive.
A bullish reversal candle, such as a pin bar or engulfing pattern, can provide confirmation before entering a BUY trade.
The stop loss can be positioned below the recent swing low, while the target can be placed near the upper channel boundary.
For a bearish setup, users can monitor a descending channel and wait for price to approach the upper channel resistance. A
bearish candle formation can confirm selling pressure, with the stop loss placed above the recent swing high and the target near the lower channel support.
Trend Confirmation
The Auto Channel Indicator can become even more effective when combined with a trend confirmation tool such as the EMA Indicator for MT4.
A simple method is to only consider BUY setups when price is trading above the EMA, indicating bullish momentum.
SELL opportunities can be considered when price remains below the EMA, showing bearish market conditions.
For example, if the Auto Channel Indicator creates an ascending channel on EUR/USD and price pulls back to the lower channel boundary while remaining above the EMA, this combination can provide stronger confirmation for a potential continuation trade.
Get Instant Free Access
Indicator Settings
- BarsForFract: Determines which candles are used for channel calculations. A value of 0 calculates using the current bar, while using closed bars can provide a more stable channel structure.
- Colors: Allows customization of the channel colors to match personal chart preferences.
- Style: Controls the visual appearance of the channel lines, including line formatting and presentation.
Important Notes
- The indicator works best when combined with price action confirmation.
- Channel signals can become less reliable during sideways market conditions.
- A breakout beyond the channel does not always guarantee a new trend.
- Higher timeframe channels generally provide stronger support and resistance levels.
- Combining channel analysis with trend filters can help reduce weaker setups.









