
The Pullback Factor indicator for MT4 is a specialized trend-following tool designed to help identify when a market retracement may be coming to an end.
Rather than entering after a trend has already moved significantly, this tool helps locate potential continuation points where price may resume its original direction.
Trend pullbacks often provide some of the best entry opportunities, but judging when a retracement is finished can be challenging.
The Pullback Factor Indicator analyzes price movement and displays a reading that helps determine whether the correction phase has reached a possible exhaustion point.
This makes it a useful addition for traders who prefer trend continuation strategies and want to combine pullback analysis with tools such as Fibonacci levels, trendlines, or price action patterns.
Why traders use the Pullback Factor Indicator
Entering a trend too late can lead to poor risk-to-reward situations, especially when price has already traveled a large distance.
The Pullback Factor Indicator helps focus attention on areas where a temporary correction may be ending and the main trend could continue.
The tool provides a numerical reading that reflects the strength of the pullback condition.
Higher readings can suggest that the retracement has reached an advanced stage, allowing users to prepare for possible continuation setups.
One advantage of this approach is that it helps reduce emotional entries.
Instead of chasing a moving market, users can wait for a pullback, monitor the reading, and look for confirmation before committing to a position.
Download This MT4 Indicator for Free
Indicator Chart Setup
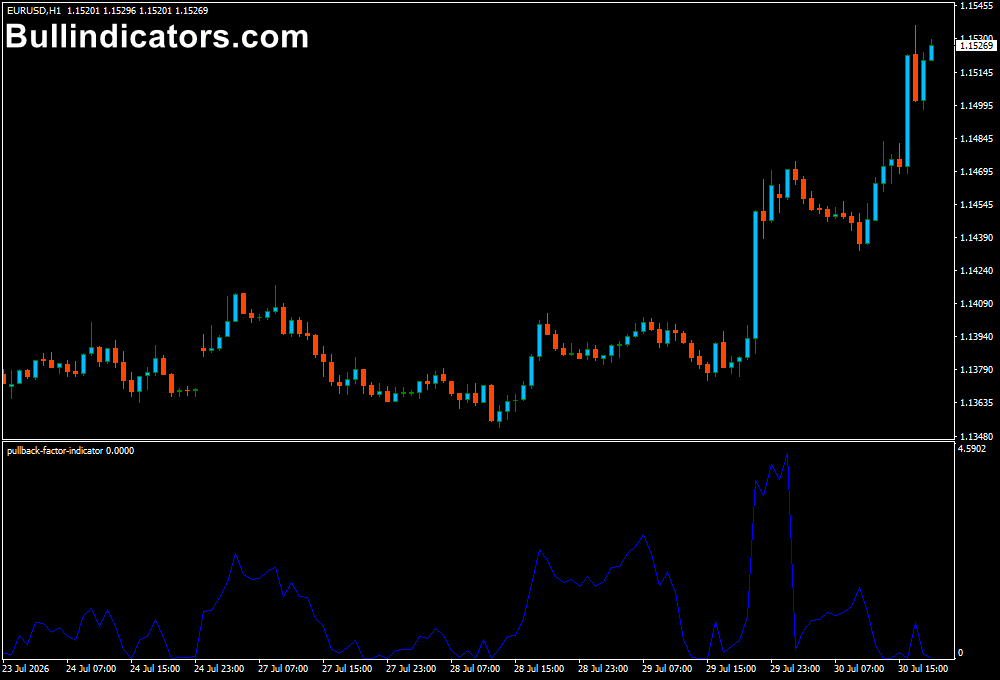
The chart display shows a Pullback Factor reading line that moves according to current market conditions.
The value helps identify whether a trend retracement may be approaching completion.
Readings typically range from 0 to 3.6.
When the value moves above 1.5, the market may have a higher probability that the pullback phase is losing strength.
This information can be combined with trend direction, support and resistance zones, or Fibonacci retracement levels to search for possible continuation trades.
Core Features
- Identifies possible trend pullback completion zones
- Displays a real-time pullback strength reading
- Supports trend continuation trading methods
- Works well with Fibonacci retracement analysis
- Helps locate potential lower-risk entry areas
- Suitable for higher timeframe market analysis
Best for
- Finding trend continuation opportunities
- Analyzing retracement phases within strong trends
- Improving entry timing after market corrections
- Combining with Fibonacci and price action methods
- Building swing trading strategies
Best Markets
- EUR/USD and GBP/USD during extended directional trends
- USD/JPY where longer market swings often develop
- Gold (XAU/USD) for identifying pullbacks during major moves
- Major indices such as NAS100 and S&P 500 CFDs
- Commodity markets with clear trending conditions
Trading Styles
- Swing trading on H4 and daily charts
- Position trading using weekly trend movements
- Trend continuation strategies after retracement phases
- Multi-timeframe analysis combining daily direction with lower timeframe entries
- Fibonacci-based trading approaches
How traders use it
The Pullback Factor Indicator is mainly used by waiting for the market to retrace against the current trend and monitoring when that correction may be losing momentum.
A strong trend combined with a high Pullback Factor reading can create a potential continuation setup.
An example
Imagine GBP/USD is moving lower on the H4 chart.
Price retraces upward toward a 61.8% Fibonacci level while the Pullback Factor reading increases above 1.5.
A bearish engulfing candle appears at the same zone, providing additional confirmation that sellers may be returning.
In one practical example, a group of swing traders used this approach on AUD/USD.
The market was in a clear downtrend, and the pullback reached a key Fibonacci area.
Once the Pullback Factor reading moved above 1.5 and bearish price action appeared, the setup offered an entry with a relatively small stop loss compared with the potential downside target.
The tool can also be combined with trend channels.
When price reaches the upper boundary of a bearish channel and the Pullback Factor suggests the correction is weakening, it may provide an opportunity to look for a continuation move.
Get Instant Free Access
Indicator Settings
- Line: Defines the chart position where the Pullback Factor line is displayed. This allows users to adjust the visual placement according to their preferred layout.
- Line Color: Controls the color of the Pullback Factor line for easier viewing and better chart customization.
Important Notes
- The Pullback Factor Indicator works best when combined with trend analysis and confirmation signals.
- Higher timeframe charts generally provide more reliable pullback readings than very short-term charts.
- The tool should not be used alone because strong price trends can experience extended retracements.
- Combining the readings with Fibonacci levels or candlestick patterns can improve setup quality.
- Scalping is not recommended because lower timeframes may produce more unreliable pullback signals.









