
Awesome Oscillator Divergence Indicator for MT5
The Awesome Oscillator Divergence indicator for MT5 is a momentum and divergence tool designed to identify changes in market direction before they become fully developed price moves.
It builds on the traditional Awesome Oscillator by comparing fast and slow simple moving averages to evaluate momentum and highlight potential turning points.
The indicator combines several forms of information in one MT5 chart tool.
A colored histogram shows the current momentum condition, while divergence lines identify situations where price movement and oscillator momentum are no longer moving in agreement.
Additional arrows can mark potential buy and sell opportunities.
Why traders use the Awesome Oscillator Divergence Indicator
Divergence can provide valuable information when a market is approaching a possible turning point.
For example, price may form a new high while oscillator momentum fails to produce a corresponding high.
This loss of momentum can warn that the current move is becoming weaker.
The Awesome Oscillator Divergence Indicator combines this analysis with histogram behavior and the zero line.
This gives the user several ways to assess momentum rather than relying on a single signal.
The colored bars also make it easier to monitor whether buying or selling pressure is increasing or weakening.
For short-term trading, the indicator can be particularly useful when divergence appears near an established support or resistance area.
A scalper could monitor an M5 chart for bearish divergence near resistance, then wait for the histogram to turn downward or cross below zero before considering a short position.
This extra confirmation can help filter premature entries.
Download This MT5 Indicator for Free
Indicator Chart Setup
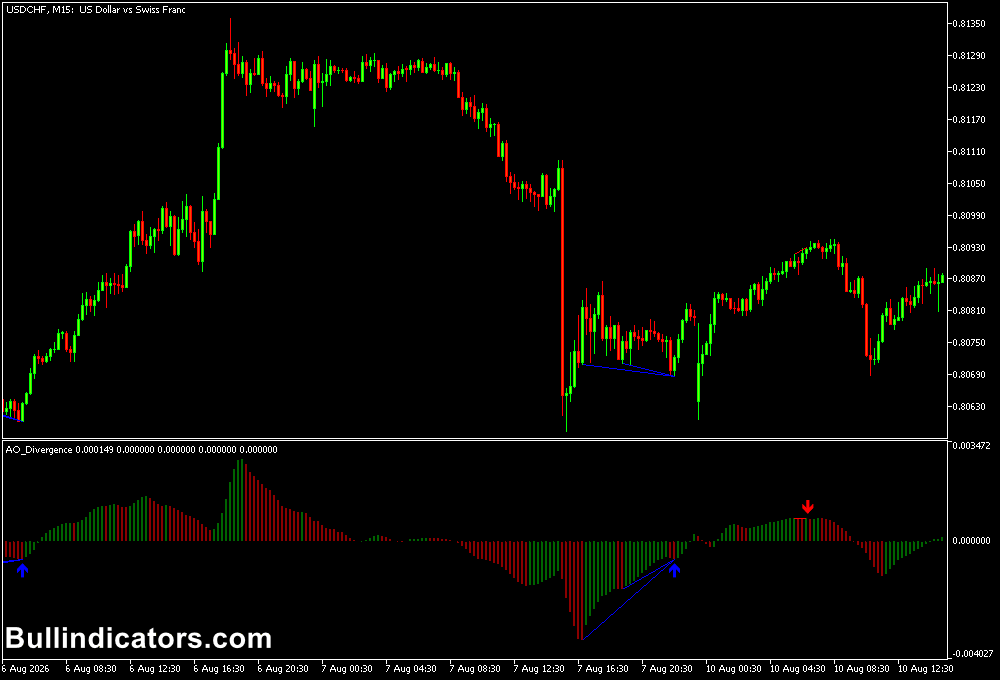
The Awesome Oscillator Divergence Indicator is displayed in a separate window below the price chart as a colored histogram.
Green bars represent rising bullish momentum, while red bars represent declining bearish momentum.
The indicator can also draw divergence lines directly in relation to price action.
Depending on the detected setup, colored lines identify potential bullish or bearish divergence.
Pinpoint arrows provide additional directional indications for possible entries.
The zero line is another important reference.
A move through zero from below can indicate improving bullish momentum, while a cross from above can indicate increasing bearish pressure.
Core Features
- Detects bullish and bearish divergence.
- Displays momentum through a colored histogram.
- Uses fast and slow SMA calculations to assess momentum.
- Draws divergence lines to highlight potential market turning points.
- Provides directional arrows for potential buy and sell setups.
- Uses the zero line as an additional momentum reference.
- Supports optional push and email alerts in MT5.
Best for
- Spotting weakening momentum before a possible reversal.
- Confirming price-action setups around support and resistance.
- Short-term momentum and divergence trading.
- Identifying potential trend continuation after a momentum reset.
- Filtering entries with histogram and zero-line confirmation.
Best Markets
- EURUSD and GBPUSD are suitable for short-term divergence analysis because their high liquidity can produce frequent momentum swings.
- USDJPY and EURJPY can work well on M15 and H1 charts when directional moves develop during active sessions.
- GBPJPY offers larger intraday movements for experienced users who understand its higher volatility.
- Gold can also be monitored on M15 and H1, although wider price fluctuations require disciplined position sizing.
Trading Styles
- Scalping: M5 charts can be used to identify short momentum reversals, with M15 serving as a directional filter.
- Intraday trading: M15 and H1 provide a useful combination for divergence-based setups.
- Reversal trading: H1 and H4 can help identify larger momentum failures near important price levels.
- Momentum continuation: M15 or H1 signals can be considered when the histogram resumes movement in the direction of the prevailing trend.
How traders use it
The indicator combines divergence, histogram direction and the zero line to help confirm potential momentum shifts.
Bullish Setup
- Price forms a lower low while the oscillator forms a higher low, creating bullish divergence.
- The histogram starts rising or moves from below toward the zero line.
- An upward arrow provides additional confirmation.
- For extra confirmation, wait for a candle to close above the signal candle’s high.
- A stop loss can be placed below the recent swing low.
Bearish Setup
- Price forms a higher high while the oscillator forms a lower high, creating bearish divergence.
- The histogram starts declining or crosses below the zero line.
- A downward arrow provides additional confirmation.
- For confirmation, wait for a candle to close below the signal candle’s low.
- A stop loss can be placed above the recent swing high.
Short-Term Example
- Pair: EURUSD
- Timeframe: M5
- Setup: Bearish divergence near a previous resistance level.
- Entry: Consider a sell after bearish histogram confirmation and a break below the signal candle’s low.
- Stop Loss: Above the recent swing high.
- Take Profit: Next support level or a predefined 1:2 or 1:3 risk-to-reward target.
The same approach can be reversed for bullish divergence near support.
Combining divergence with histogram and price-action confirmation can help filter weaker signals.
Get Instant Free Access
Indicator Settings
- Deviation_precent: Defines the deviation percentage used when detecting divergence.
- Indicator_Trend_Line_Allowed: Controls whether the indicator trend line is permitted to extend across the chart.
- Numberof_Alerts_Maximum_Iterations: Determines the maximum number of alert iterations generated by the indicator.
- Allow to send push-messages: Enables push notifications through MetaTrader 5 when an alert is triggered.
- Allow to send e-mail messages: Enables email notifications for indicator alerts.
- Allow to put alert: Enables the indicator’s MT5 alert function.
Important Notes
- Divergence indicates a potential momentum change but does not guarantee that price will reverse.
- Strong trends can produce divergence signals that fail before the main trend resumes.
- Using support, resistance or higher-timeframe direction can help filter weaker setups.
- The zero-line crossing can provide additional confirmation but may occur after part of the move has already developed.
- Short-term signals on M5 and M15 can be more frequent and require disciplined trade selection.
- Alert functions can be enabled according to your preferred notification method.









