
The Wolfe Waves indicator for MT4 is an advanced price action tool designed to automatically identify Wolfe Wave patterns on the technical chart.
Based on the same market principles used in advanced wave analysis, this indicator helps locate potential reversal points and forecast possible future price movements.
Wolfe Waves are powerful chart patterns that consist of five price waves developing within a channel structure.
Manually identifying these formations can be difficult because the pattern requires specific wave relationships and timing symmetry.
This indicator simplifies the process by scanning price movements and highlighting possible Wolfe Wave formations automatically.
The tool can be used across different markets and timeframes, making it suitable for traders who focus on short-term opportunities as well as longer-term market analysis.
Why traders use the Wolfe Waves Indicator
Wolfe Wave patterns are popular among price action traders because they can provide insight into possible trend exhaustion and reversal areas.
The main challenge is identifying the correct wave structure, as incorrect pattern drawing can lead to poor trading decisions.
The Wolfe Waves Indicator removes much of the manual work by automatically searching for valid wave formations and displaying them directly on the chart.
This allows users to focus on analyzing the pattern and planning potential entries, stop loss placement, and profit targets.
The indicator is particularly useful for experienced price action traders who understand wave concepts.
Not Beginner Friendly!
Beginners should first learn how Wolfe Waves work before relying on the signals.
A simpler confirmation tool, such as the MA Crossover Alert Indicator for MT4, can be a better starting point because it provides easier-to-understand signals.
The MA Crossover Alert Indicator follows a simple approach:
A bullish crossover creates a BUY arrow, while a bearish crossover generates a SELL arrow.
This makes it easier for new traders to identify momentum changes before moving into more advanced pattern analysis.
Download This MT4 Indicator for Free
Indicator Chart Setup
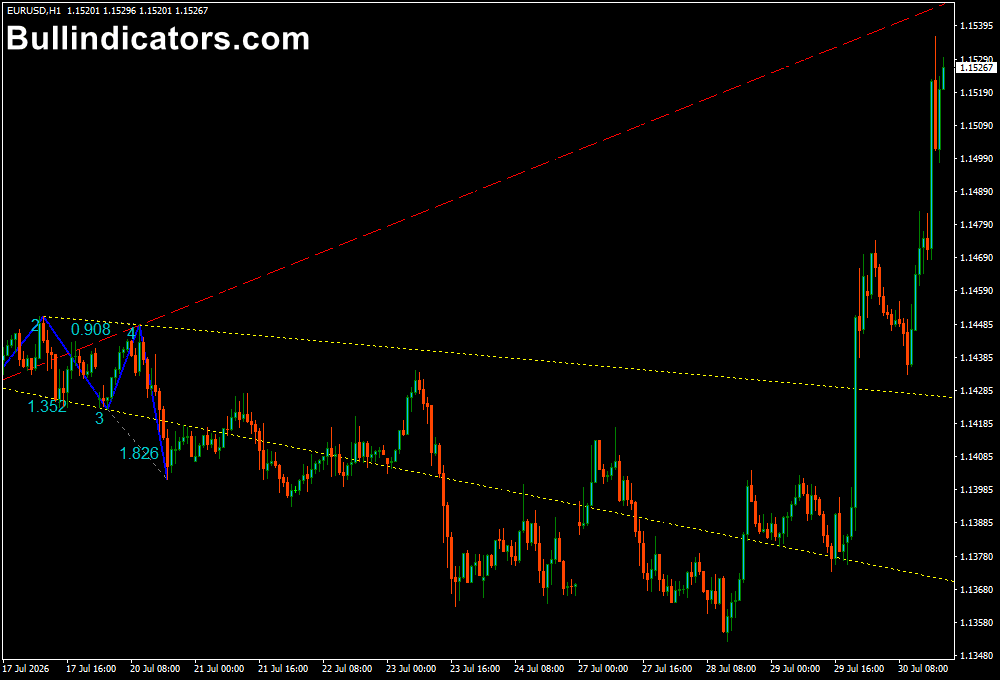
The chart display highlights detected Wolfe Wave formations by marking the different wave points and connecting trendlines.
The pattern shows how price moves between the initial waves and creates a potential target area based on the projected channel.
A valid Wolfe Wave formation consists of five waves.
The third and fourth waves develop inside the channel created by the first and second waves, while the fifth wave often represents the expected move after the pattern completes.
Once the fourth wave reaches the channel boundary, users can monitor the market for possible reversal confirmation before considering an entry.
Core Features
- Automatically detects Wolfe Wave patterns
- Displays wave structures directly on the chart
- Helps identify possible reversal zones
- Projects potential price targets using wave channels
- Works on multiple currency pairs and timeframes
- Reduces the difficulty of manually drawing Wolfe patterns
Best for
- Advanced price action analysis
- Pattern-based reversal trading
- Identifying possible trend exhaustion areas
- Combining wave analysis with market structure
- Studying professional chart formations
Best Markets
- GBP/USD and EUR/USD where clear wave structures often develop
- GBP/CHF and other pairs with strong price swings
- Gold (XAU/USD) during extended directional movements
- Major indices such as NAS100 and US30 with larger wave formations
- Cryptocurrency markets where strong trends create visible patterns
Trading Styles
- Swing trading using H4, Daily, and Weekly charts
- Position trading based on larger reversal formations
- Price action strategies focused on chart patterns
- Multi-timeframe analysis for trend reversal opportunities
- Technical pattern trading combined with confirmation tools
How traders use it
The Wolfe Waves Indicator is generally used by waiting for the pattern to develop before entering a trade.
The fourth wave is considered an important point because it can signal that the fifth wave movement may soon begin.
For a bullish Wolfe Wave setup, traders look for a completed bearish fourth wave followed by signs that buyers are returning.
The potential target is often based on the projected channel line created by previous waves.
For a bearish Wolfe Wave setup, the fourth wave moves upward before a possible downward fifth wave develops.
More Simple Setup
A common approach is to enter after confirmation, place the stop loss beyond the recent swing point, and target the opposite side of the channel.
For example, on a GBP/CHF weekly chart, the indicator may identify a complete Wolfe Wave formation where the fourth wave reaches the channel boundary.
Once price begins moving in the expected fifth-wave direction, the pattern can provide a favorable risk-to-reward opportunity.
Because Wolfe Waves require understanding of pattern structure, beginners may find it challenging at first.
Combining this advanced tool with a simpler confirmation method can make the learning process easier.
For example, a Wolfe Wave bullish reversal combined with a BUY arrow from the MA Crossover Alert Indicator can provide additional confirmation that momentum is shifting upward.
Get Instant Free Access
Indicator Settings
- First One: Controls how many Wolfe Wave formations are displayed on the chart. When enabled, the indicator can show the latest detected wave pattern only, helping maintain a cleaner chart.
- Colors: Allows customization of the Wolfe Wave lines and pattern appearance.
- Line Style: Adjusts the visual style of the lines used to display the wave structure.
Important Notes
- Wolfe Waves are an advanced trading concept and require practice to understand properly.
- The pattern should be confirmed with market conditions and additional analysis before entering trades.
- Lower timeframes may contain more false formations compared with higher timeframe charts.
- Risk management remains important because no chart pattern guarantees a successful trade.
- Beginners may benefit from starting with simpler tools before using advanced wave analysis.









