
Markets often spend more time moving between established price boundaries than making sustained directional moves.
The Cap Channel Trading Indicator for MT4 is designed for this type of environment, plotting a volatility-sensitive channel around price and highlighting areas where a reaction may develop.
The upper and lower boundaries help define where price is becoming relatively extended.
When price approaches the lower band and a red cross appears, it can point to a potential bullish reversal.
A blue cross near the upper band can signal a possible bearish turn.
This makes the tool useful for traders who prefer working with market ranges and waiting for price to reach defined extremes.
Why traders use the Cap Channel Trading Indicator
Channel trading requires patience. Entering in the middle of a range often leaves little room before the opposite side is reached.
The Cap Channel helps shift attention toward the edges of the current price range, where risk and potential reward can be assessed more effectively.
- Adapts the channel to changing market volatility.
- Highlights potential overbought and oversold areas.
- Provides reversal crosses around the channel boundaries.
- Can help with both entry and exit decisions.
- Suitable for short-term and longer-term analysis.
Download This MT4 Indicator for Free
Indicator Chart Setup
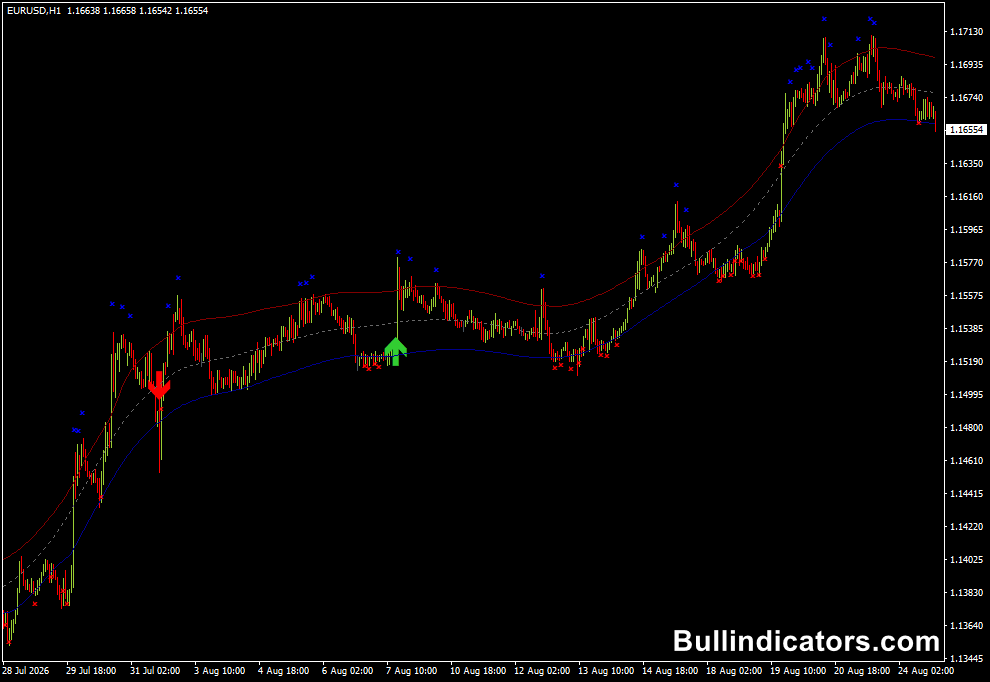
The Cap Channel appears directly on the MT4 price chart as an upper and lower band surrounding market price.
The distance between these boundaries responds to volatility, so the channel can expand during active periods and contract when price movement becomes quieter.
The upper boundary can be treated as a potential resistance zone, while the lower boundary can serve as a potential support area.
The colored crosses provide an additional indication when price reaches these regions.
A red cross is associated with a bullish reversal, while a blue cross points toward a bearish reversal.
Core Features
- Volatility-sensitive price channel.
- Upper and lower trading boundaries.
- Red bullish reversal crosses.
- Blue bearish reversal crosses.
- Potential support and resistance zones.
- Configurable alert functions.
Best for
- Range-bound market conditions.
- Reversal setups near channel extremes.
- Identifying potential entry and exit areas.
- Combining channel signals with candlestick analysis.
- Monitoring volatility-driven price expansions.
Best Markets
- EURUSD and GBPUSD for liquid Forex sessions.
- USDJPY and AUDUSD when price respects established ranges.
- Gold, particularly when intraday swings repeatedly return toward the channel centre.
- Major indices where volatility can create well-defined upper and lower boundaries.
Trading Styles
- Intraday channel trading on M15, M30 and H1.
- Swing trading on H4 and daily charts.
- Reversal trading around established support and resistance.
- Short-term setups during quieter range-bound sessions.
How traders use it
A typical setup begins with waiting for price to approach one of the channel boundaries.
When price reaches the lower band, traders can look for evidence that selling pressure is fading.
A red cross combined with a bullish candlestick formation can provide the basis for a long setup.
The stop loss can be placed beneath the recent swing low, while the upper channel provides a logical area for profit-taking.
For a short setup, the process is reversed.
Price approaches the upper boundary, a blue cross appears, and bearish price action can be used as confirmation.
A stop loss can sit above the recent swing high, with the lower channel serving as a potential target.
The strongest results usually come when the channel reading agrees with the broader market direction.
Trading example
One of the more interesting ways to use the Cap Channel is to combine the channel location with the story told by price action.
A market that repeatedly rejects the lower boundary is showing a very different character from one that breaks through it with strong momentum.
Learning to distinguish those two situations is what turns a simple channel into a more practical trading framework.
Get Instant Free Access
Indicator Settings
- Time frame – Selects the timeframe used for the channel calculation.
- Half-length – Controls the calculation period for the channel’s middle line.
- Price – Determines the price input used for calculating band deviation.
- Interpolate – Controls whether interpolation is applied when creating the channel lines.
- Bands Deviation – Adjusts the deviation used for positioning the channel boundaries.
- Alerts On – Enables or disables indicator alerts.
- Alerts on Current – Controls alerts generated from the current candle.
- Alerts on High low – Enables alerts based on price highs and lows.
Important Notes
- A channel boundary is a potential reaction area, not a guarantee that price will reverse.
- Strong breakouts can push price beyond the channel, particularly during major economic releases.
- Check the higher-timeframe trend before taking reversal trades against the broader movement.
- Support, resistance and candlestick confirmation can improve the quality of channel setups.
- The indicator can be used on 15-minute charts and higher, making it suitable for both intraday and swing analysis.









