
The MTF Fractal indicator for MT4 brings fractal levels from different timeframes onto a single chart.
This makes it easier to monitor previous swing highs and lows while focusing on a lower timeframe for an entry.
For scalpers and intraday traders, this can be particularly useful because important levels from a higher timeframe remain visible without constantly changing charts.
Fractals are formed around local price extremes and can highlight areas where the market has previously changed direction.
The multi-timeframe version takes this concept further by allowing a selected timeframe to provide the fractal levels displayed on the active chart.
This makes the tool useful for breakout setups, pullback entries and support and resistance analysis.
Why traders use the MTF Fractal Indicator
One of the main advantages is the ability to combine higher-timeframe context with lower-timeframe execution.
A scalper working on M5, for example, can monitor H1 fractal levels while waiting for a short-term setup.
The plotted levels can also provide practical reference points for stop-loss placement and profit targets.
When price approaches a previous swing high or low, traders can watch how the market reacts before committing to a position.
Download This MT4 Indicator for Free
Indicator Chart Setup
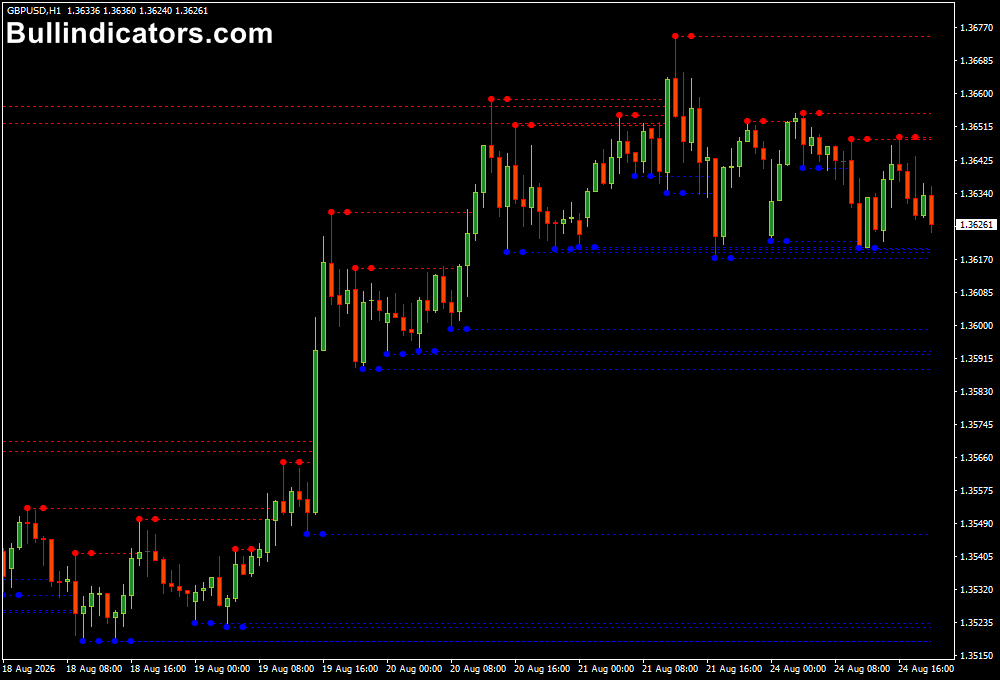
The MTF Fractal indicator displays fractal levels from the selected timeframe.
Up and down fractals are represented by different colored lines, allowing the two types of swing points to be distinguished quickly.
The lines extend across the chart and can remain relevant as price develops.
Moving the cursor over a level can also provide information about the timeframe responsible for that fractal and its price value.
This is particularly convenient when several timeframes are being monitored from one chart.
Core Features
- Displays multi-timeframe fractal levels on one MT4 chart.
- Highlights previous swing highs and swing lows.
- Allows a specific fractal timeframe to be selected.
- Provides useful levels for breakout and pullback setups.
- Can be applied to different currency pairs and financial markets.
Best for
- Locating important intraday swing levels.
- Confirming breakout areas before entering a position.
- Finding potential support and resistance during scalping.
- Combining higher-timeframe analysis with lower-timeframe entries.
Best Markets
- EURUSD and GBPUSD are well suited to short-term setups because of their liquidity.
- GBPJPY can offer interesting fractal breakouts during active London sessions.
- Gold can be monitored for larger intraday swings and reactions around established levels.
- Major stock indices can also benefit from multi-timeframe swing analysis.
Trading Styles
- Scalping on M1 and M5 charts with higher-timeframe fractal confirmation.
- Intraday trading using M5, M15 and H1 levels.
- Breakout trading around established fractal highs and lows.
- Pullback trading when price returns to a previously formed swing level.
How traders use it
A practical approach is to begin with a higher timeframe and identify the nearest significant fractal levels.
The lower chart can then be used to determine whether price is breaking through the level, rejecting it or consolidating around it.
For a bullish setup, a trader may wait for price to break above a fractal high and then look for a bullish candle to confirm the move.
A buy entry can follow, with the recent swing low providing a possible stop-loss reference.
The next resistance or higher fractal can become a profit target.
For a bearish setup, the process is reversed.
A break below a fractal low followed by bearish price action can provide a short opportunity.
A stop can be positioned above the recent swing high, while a lower fractal or support area provides a potential exit.
This approach is especially useful for scalping.
For example, an M5 chart can use H1 fractals to identify the major levels while the M5 candles provide the actual entry.
This reduces the temptation to react to every small movement and keeps the short-term trade connected to a broader price level.
Get Instant Free Access
Indicator Settings
- Maxbar: Sets the maximum number of bars or candles used for displaying fractals.
- Fractal_Timeframe: Selects the timeframe used to calculate the fractals. A value of zero uses the current chart timeframe.
- Up_Fractal_Symbol: Determines how far the up-fractal levels are extended across the chart.
- Down_Fractal_Symbol: Determines how far the down-fractal levels are extended across the chart.
Important Notes
- A fractal identifies a previous price swing; it does not guarantee that price will reverse from that level.
- Higher-timeframe fractals generally carry more significance for intraday analysis than very short-term levels.
- Combining a fractal level with price action or another confirmation method can help filter weaker setups.
- Always account for the distance to the next support or resistance level before entering a trade.









