
The Custom High and Low indicator for MT5 automatically plots the current and previous daily, weekly, and monthly high and low levels on the chart.
These price levels are closely watched by traders because they often act as important support, resistance, breakout, and reversal zones.
By displaying multiple timeframe levels simultaneously, the indicator gives traders a broader view of market structure without switching between charts, making it easier to plan high-probability trading opportunities.
Why traders use the Custom High and Low Indicator
Previous highs and lows frequently influence future price movement because many market participants monitor these levels.
A break above a previous high may signal growing bullish momentum, while a move below a previous low can indicate increasing selling pressure.
Knowing where these levels are located helps traders anticipate possible market reactions before they occur.
The Custom High and Low Indicator automatically updates these key levels, allowing traders to focus on price action rather than manually marking the chart.
Many users combine the indicator with trend analysis, breakout strategies, or candlestick confirmation to improve the timing of their entries and exits.
Download This MT5 Indicator for Free
Indicator Chart Setup
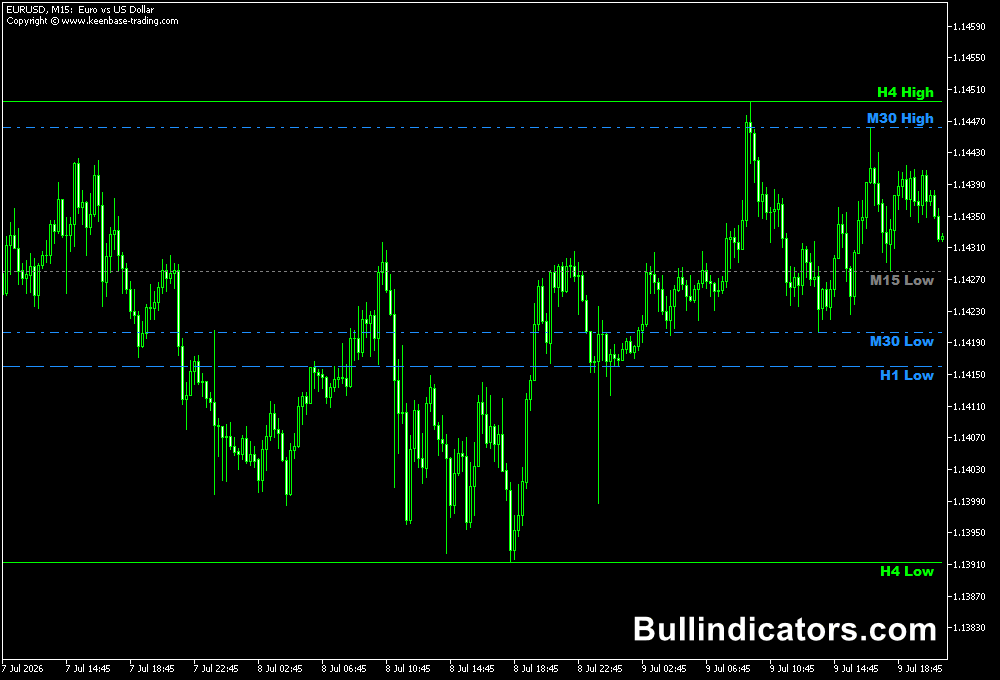
After applying the indicator, horizontal lines are drawn for the current and previous daily, weekly, and monthly highs and lows.
These reference levels remain visible throughout the trading session, allowing traders to immediately identify nearby support and resistance.
The chart provides a complete multi-timeframe overview, making it easy to recognize when several important price levels align within the same area.
Core Features
- Displays daily, weekly, and monthly high and low levels.
- Plots both current and previous timeframe levels.
- Automatically updates as new trading periods begin.
- Provides a multi-timeframe market overview.
- Supports breakout and reversal analysis.
- Offers customizable display options.
Best for
- Support and resistance trading.
- Multi-timeframe analysis.
- Breakout strategies.
- Trend confirmation.
- Planning entry and exit levels.
Best Markets
- Markets that regularly respect previous session highs and lows before starting new directional moves.
- Forex pairs with strong daily volatility during the London and New York sessions.
- Index markets where weekly highs and lows often become institutional reference levels.
- Commodities that experience frequent breakout and retest patterns.
- Liquid financial instruments where historical price levels attract consistent market attention.
Trading Styles
- Scalping.
- Day trading.
- Swing trading.
- Breakout trading.
- Price action trading.
How traders use it
Many traders watch for price to approach a previous daily, weekly, or monthly high before looking for either a breakout or a rejection signal.
If price breaks decisively through one of these levels, it may indicate that momentum is strengthening in that direction.
Conversely, repeated rejection at an established high or low can provide opportunities to trade reversals.
When multiple timeframe levels overlap, they often create stronger support or resistance zones that deserve additional attention.
Get Instant Free Access
Indicator Settings
- HL Period – Selects the calculation period used by the indicator.
- Show Previous Daily – Displays the previous day’s high and low levels.
- Extend Previous Daily Line – Extends the previous daily levels further across the chart.
- Show Previous Weekly – Displays the previous week’s high and low levels.
- Extend Previous Weekly Line – Extends the previous weekly levels across additional candles.
- Show Previous Monthly – Displays the previous month’s high and low levels.
- Extend Previous Monthly Line – Extends the previous monthly levels further into future price action.
- Previous Daily Line Color – Changes the color of the previous daily high and low lines.
- Previous Weekly Line Color – Changes the color of the previous weekly high and low lines.
- Font Size – Adjusts the size of the indicator labels displayed on the chart.
Important Notes
- Higher timeframe highs and lows generally carry greater technical significance than lower timeframe levels.
- Previous daily, weekly, and monthly levels often serve as natural breakout or reversal zones.
- Confluence between several timeframe levels can strengthen support and resistance.
- The indicator can be combined with trend analysis, moving averages, or candlestick patterns for additional confirmation.
- Strong price momentum should always be considered before trading around major historical levels.









