
The MACD Histogram indicator for MT5 combines moving average crossover analysis with a two-color histogram that makes changes in market momentum easier to monitor.
It compares a faster and slower moving average and presents the resulting momentum through colored histogram bars.
Green bars indicate bullish conditions, while red bars point toward bearish momentum.
The color transition can therefore be used as a simple signal for following changes in directional pressure.
The indicator is flexible enough for short-term intraday charts as well as longer-term analysis, making it suitable for scalping, swing trading and trend-following strategies.
One useful application is combining the histogram with another directional tool.
For example, the 3 MA Cross Alert Indicator for MT5 can provide an additional confirmation layer, with its blue arrow representing a bullish crossover and its red arrow identifying a bearish crossover.
Why traders use the MACD Histogram Indicator
The histogram provides a quick way to assess whether momentum is favoring buyers or sellers.
Rather than relying solely on the position of two moving averages, the changing bar colors provide an additional visual representation of the current directional bias.
The indicator can also be adapted to different trading horizons by changing the calculation periods.
Faster settings can respond more quickly to intraday movements, while slower settings can reduce sensitivity when analyzing larger trends.
Download This MT5 Indicator for Free
Indicator Chart Setup
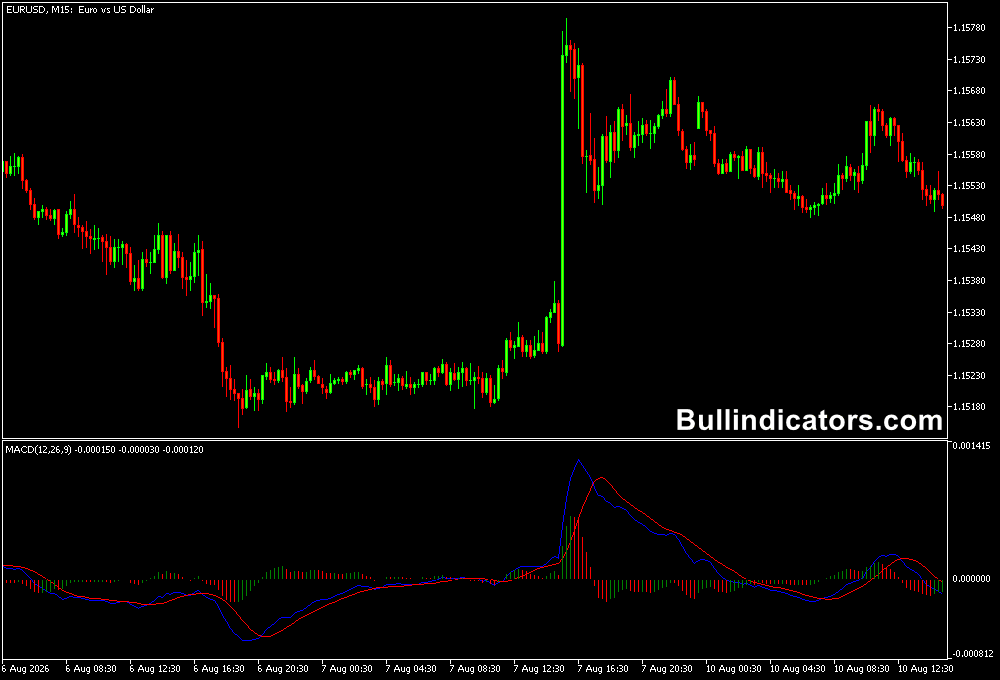
The MACD Histogram is displayed in a separate window below the price chart. Its bars fluctuate around the central level and change between green and red according to the calculated market momentum.
A transition to green suggests that bullish pressure is developing, while a switch to red signals that bearish momentum is taking control.
The histogram can be read on its own, although combining its signals with price action or a separate trend indicator can help filter weaker transitions.
Core Features
- Combines fast and slow moving average calculations.
- Displays momentum through a two-color histogram.
- Green bars represent bullish conditions.
- Red bars represent bearish conditions.
- Adjustable fast EMA and slow EMA periods.
- Configurable signal moving average.
- Supports different applied prices and moving average methods.
- Suitable for intraday and higher-timeframe analysis.
Best for
- Monitoring changes in short-term momentum.
- Following established directional moves.
- Confirming moving average crossover signals.
- Filtering entries with a second trend indicator.
- Scalping and intraday momentum strategies.
Best Markets
- EURUSD is a practical choice for M5 and M15 momentum setups because of its liquidity.
- GBPUSD can suit faster intraday strategies when London and New York sessions produce strong movement.
- USDJPY works well for M15 and H1 trend-following approaches.
- Gold can be used on M15 and H1 by experienced users who account for its larger price swings.
- Major currency pairs with relatively low spreads are generally preferable for frequent histogram-based entries.
Trading Styles
- M5 scalping using histogram color changes with additional crossover confirmation.
- M15 momentum trading on EURUSD and GBPUSD.
- H1 trend following when the histogram maintains one color through a sustained move.
- H4 swing trading for broader directional signals.
- Multi-timeframe setups using H1 for direction and M5 or M15 for entry timing.
How traders use it
The basic method is to monitor the histogram for a change from red to green or green to red.
A green transition can indicate that bullish momentum is emerging, while a red transition can signal increasing selling pressure.
The strongest setups often occur when the histogram agrees with the broader market direction.
EURUSD Buy Example with 3 MA Cross Alert
Consider EURUSD on the M15 chart with both indicators running.
The 3 MA Cross Alert indicator produces a blue arrow, indicating a bullish crossover.
For additional confirmation, wait for the MACD Histogram to turn green.
When both signals point upward, the setup has greater directional agreement.
- EURUSD is showing improving price momentum.
- The 3 MA Cross Alert produces a blue bullish arrow.
- The MACD Histogram changes from red to green.
- Wait for the bullish signals to remain valid rather than entering during a brief intrabar fluctuation.
- Consider a buy entry after confirmation.
- Place the stop below the latest relevant M15 swing low.
- Manage the position while the histogram remains green and the bullish trend continues.
For example, if EURUSD breaks above a recent resistance level while the blue arrow and green histogram appear together, the combination provides both crossover and momentum confirmation.
A return to red can then serve as a warning that the bullish move is weakening.
GBPUSD Sell Example with 3 MA Cross Alert
For a bearish setup, consider GBPUSD on M15. The 3 MA Cross Alert produces a red arrow, indicating a bearish crossover.
The MACD Histogram then changes from green to red, confirming that momentum has shifted toward the downside.
- GBPUSD begins to weaken after an upward correction.
- The 3 MA Cross Alert displays a red bearish arrow.
- The MACD Histogram changes to red.
- Price breaks below a nearby support level or recent swing low.
- Consider a short entry after the bearish confirmation.
- Place the stop above the latest M15 swing high.
- Continue monitoring the histogram for a return to green as a potential exit warning.
Get Instant Free Access
Indicator Settings
- Fast EMA Period – sets the period of the faster exponential moving average.
- Slow EMA Period – controls the slower moving average calculation.
- Signal MA – determines the signal moving average period.
- Applied MA Method – selects the moving average calculation method.
- Use Multicolor – enables the colored histogram display.
- Applied Price – selects the price type used for the indicator calculations.
Important Notes
- Histogram color changes can occur frequently during sideways markets.
- A crossover signal is more useful when supported by the broader price direction.
- The indicator does not provide a fixed profit target, so exits should be based on momentum, price levels or a defined risk-reward plan.
- Very short timeframes require attention to spread and execution costs.
- Do not treat a single histogram bar as confirmation of a sustained trend; consider the surrounding price movement as well.









