
The Market Profile Trend Lines indicator for MT4 is an advanced market analysis tool that displays where price activity is concentrated during a trading session.
By combining price movement, time, and tick information, the indicator creates a visual market profile that highlights important price zones, value areas, and potential reaction levels.
Unlike traditional technical indicators that calculate momentum or trends from formulas, this tool focuses on market behavior.
It shows where buyers and sellers have actively participated, helping traders understand areas where price may continue, slow down, or reverse.
The addition of automatically generated trendlines makes this version of the Market Profile concept useful for traders who want a clearer view of important price structures while analyzing intraday and higher timeframe opportunities.
Why traders use the Market Profile Trend Lines Indicator
Professional market analysis often focuses on understanding where the majority of trading activity takes place.
The Market Profile Trend Lines Indicator helps identify these areas by showing price acceptance zones and levels where the market previously rejected prices.
The value area is one of the most important elements because it represents the region where a large amount of trading activity occurred.
Prices moving away from this area can provide clues about potential momentum, while rejected areas may highlight possible reversal zones.
A major benefit of this tool is that it removes the need to manually study every price level.
The profile structure provides a visual overview of market participation, allowing users to focus on planning entries and exits with better context.
Download This MT4 Indicator for Free
Indicator Chart Setup
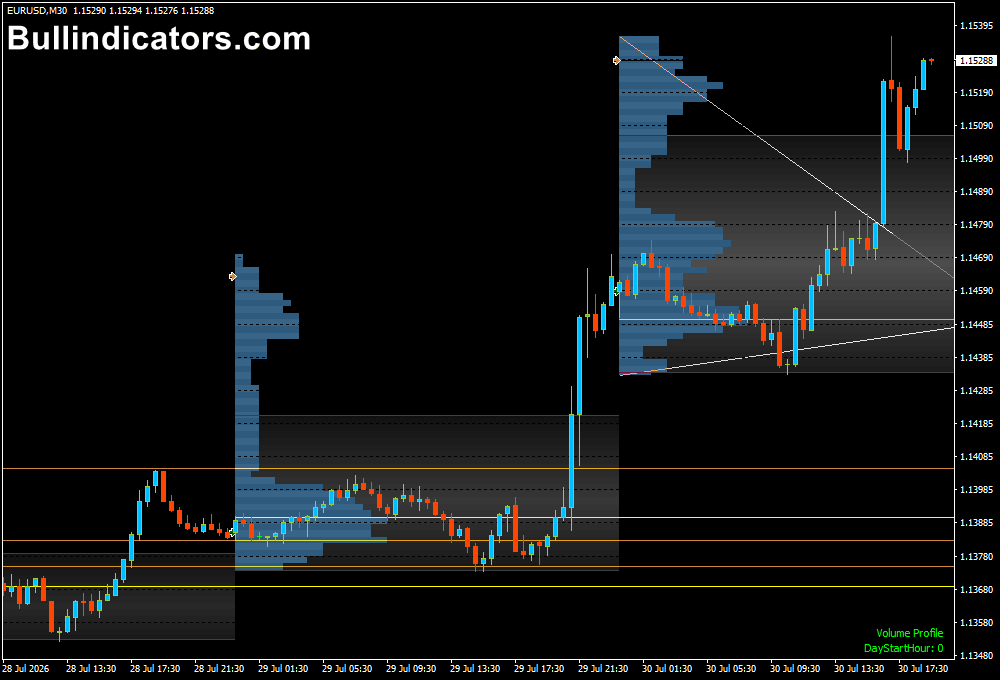
The chart display creates a market profile histogram that shows where price spent the most time and where trading activity was concentrated.
The profile is displayed from right to left, helping users focus on the current trading session and important price zones.
The indicator highlights the value area together with upper and lower profile tails.
These tails represent areas where price moved away quickly, often showing stronger buying or selling pressure.
For example, a large lower tail may indicate that sellers pushed price lower but buyers quickly absorbed the selling pressure.
A large upper tail may suggest that buyers attempted to move higher but sellers regained control.
Core Features
- Displays market profile zones based on price activity
- Highlights value areas and important trading levels
- Uses tick data to analyze market participation
- Includes automatically generated trendlines
- Shows current session price density
- Works across multiple timeframes from M1 to D1
Best for
- Analyzing institutional-style price activity
- Finding high-volume reaction zones
- Identifying potential reversal areas
- Planning intraday entries around value areas
- Combining market profile analysis with price action
Best Markets
- EUR/USD and GBP/USD during active London and New York sessions
- Gold (XAU/USD) where price reacts strongly around key levels
- NAS100 and US30 during high-volume trading periods
- Major futures-style markets with strong liquidity movement
- Cryptocurrency pairs where volume concentration creates visible zones
Trading Styles
- Intraday trading based on session profiles
- Scalping around value areas on M1 to M15 charts
- Day trading using H1 and H4 market zones
- Price action trading with profile confirmation
- Market structure analysis for larger trend decisions
How traders use it
The Market Profile Trend Lines Indicator is commonly used to locate areas where price is accepted or rejected.
A trader can observe whether price remains inside the value area or begins moving away with strong momentum.
Practical Example
A practical example can be seen on EUR/USD during the London session.
The indicator identifies a value area between 1.0850 and 1.0870, while a large lower tail develops near 1.0835.
Price briefly drops into this zone but quickly returns above the value area, showing that buyers are defending the lower prices.
A possible BUY setup would involve waiting for bullish price action confirmation, such as a bullish engulfing candle or strong close above the value area.
The stop loss can be placed below the rejected low, while the target can be set near the opposite side of the profile or the next resistance zone.
For a SELL setup, users can look for the opposite situation.
If price moves above the value area, creates a large upper tail, and fails to continue higher, this may indicate selling pressure.
A bearish candle confirmation can provide an entry opportunity with a stop loss above the recent high.
Many experienced users combine market profile analysis with moving averages or trend tools.
For example, trading only BUY setups when price is above a major moving average can help align profile signals with the broader market direction.
Get Instant Free Access
Indicator Settings
- LookBack: Defines how many previous market profiles are displayed. Increasing this value provides more historical context, while a lower value focuses on recent activity.
- UseVolumeProfile: When enabled, the indicator displays the current volume profile information to show where trading activity is concentrated.
- ProfileTimeframeInfo: Displays profile information from a selected timeframe, allowing multi-timeframe analysis.
- ProfileTimeframe: Determines which timeframe is used to calculate the market profile.
- DayStartHour: Defines the starting hour for creating daily market profiles based on the preferred trading session.
- VATPO Percent: Controls the percentage calculation used for displaying the value area within the selected profile timeframe.
- TickSize: Sets the number of ticks used in the profile calculation, affecting the level of detail shown on the chart.
Important Notes
- Market Profile analysis works best when combined with price action confirmation.
- High activity zones do not guarantee immediate price reactions and should be analyzed with market conditions.
- Lower timeframes may contain more noise compared with higher timeframe profiles.
- The indicator provides market context and should be used together with proper risk management.
- Session times can influence the accuracy of market profile analysis, especially during major market openings.









