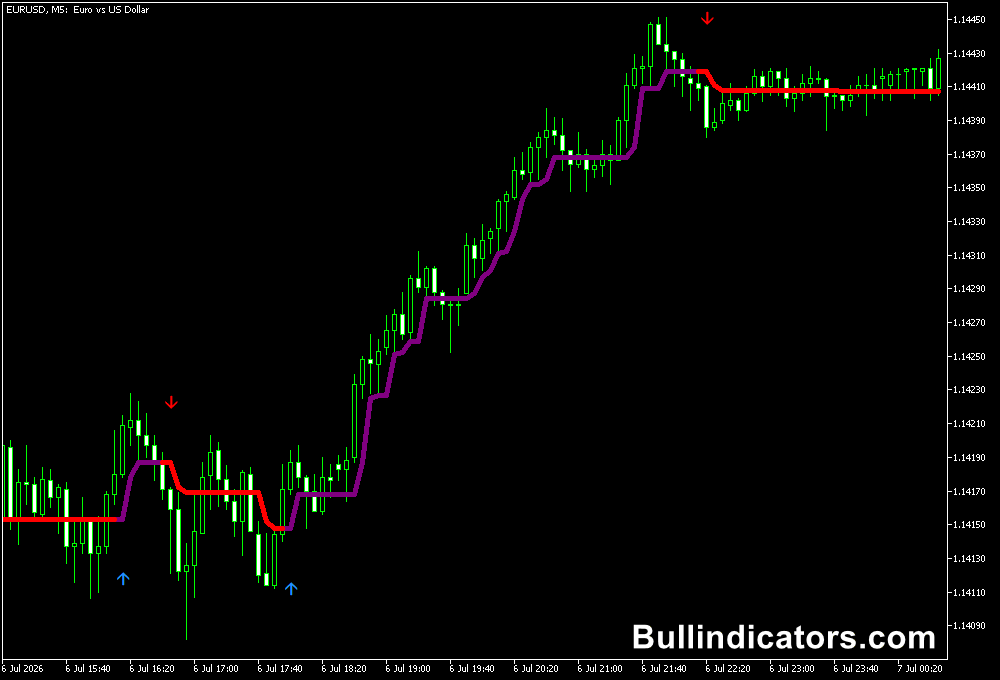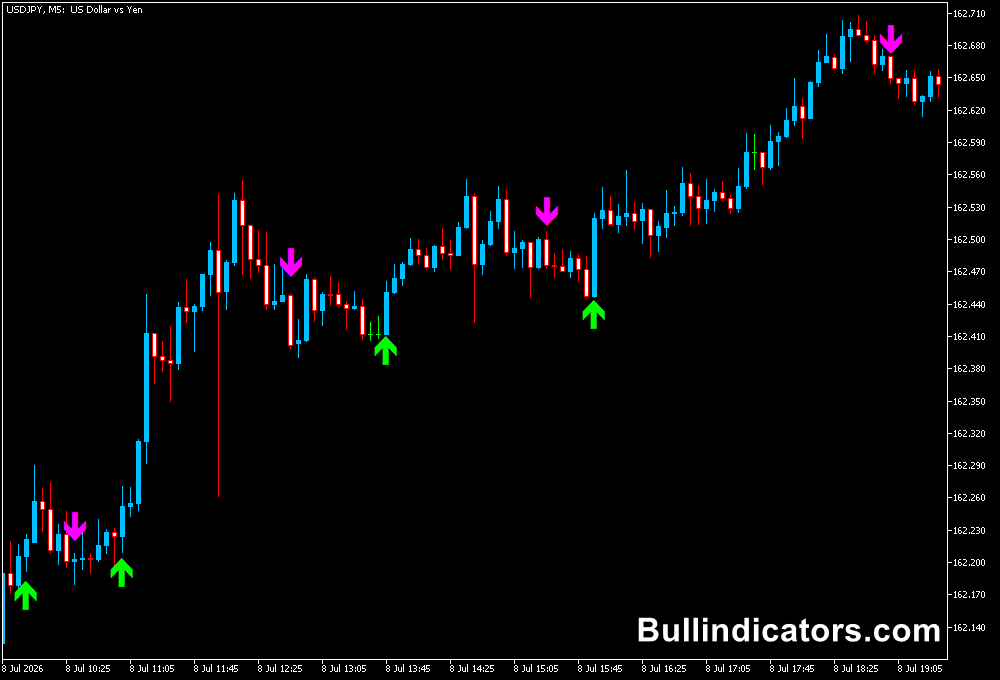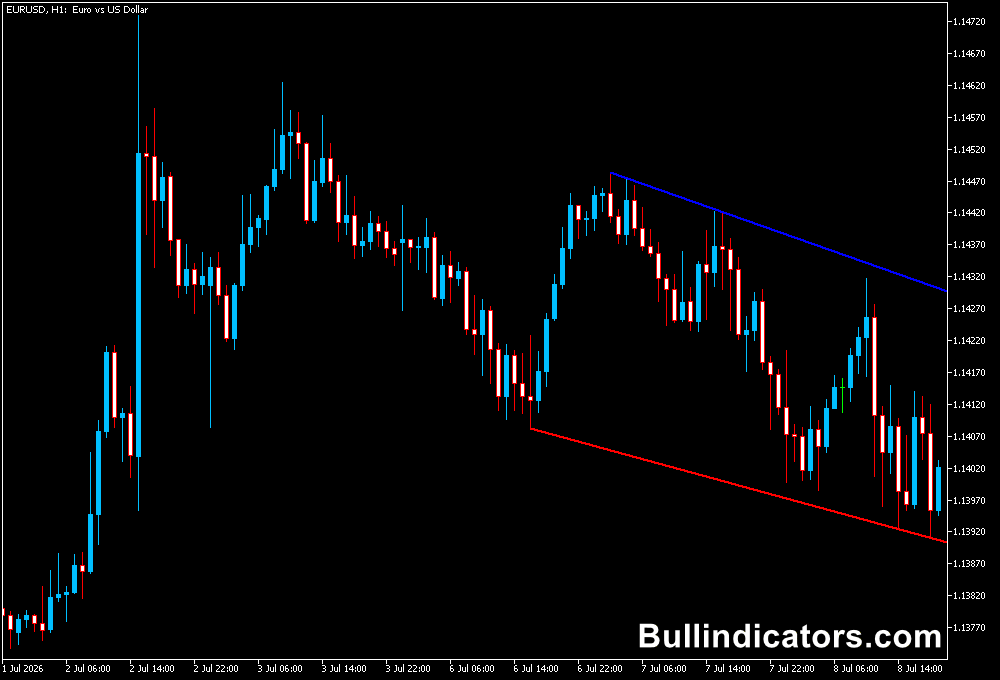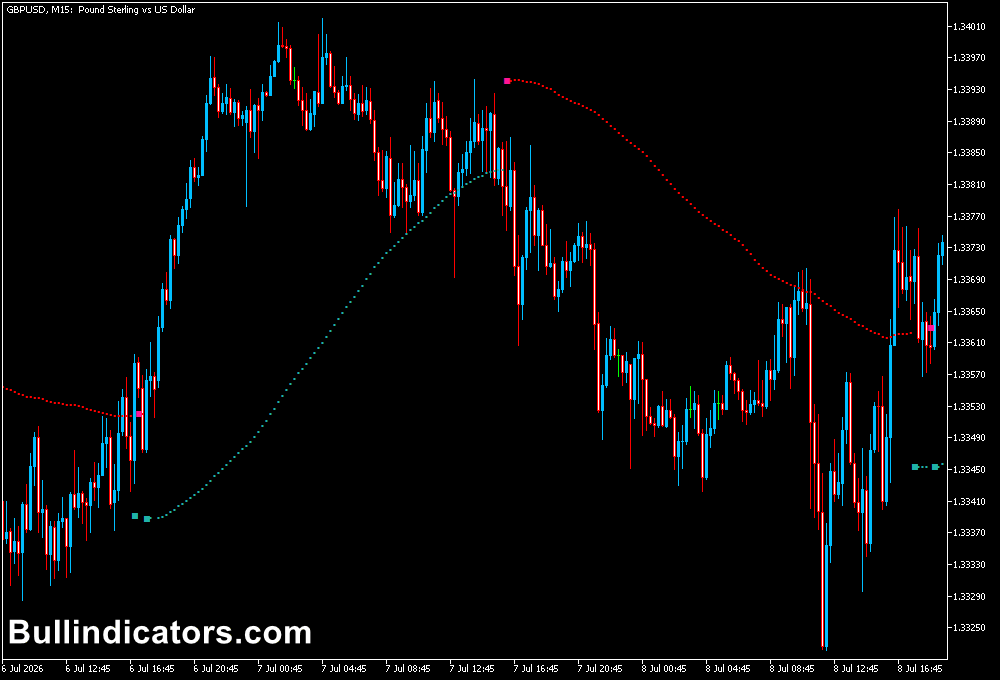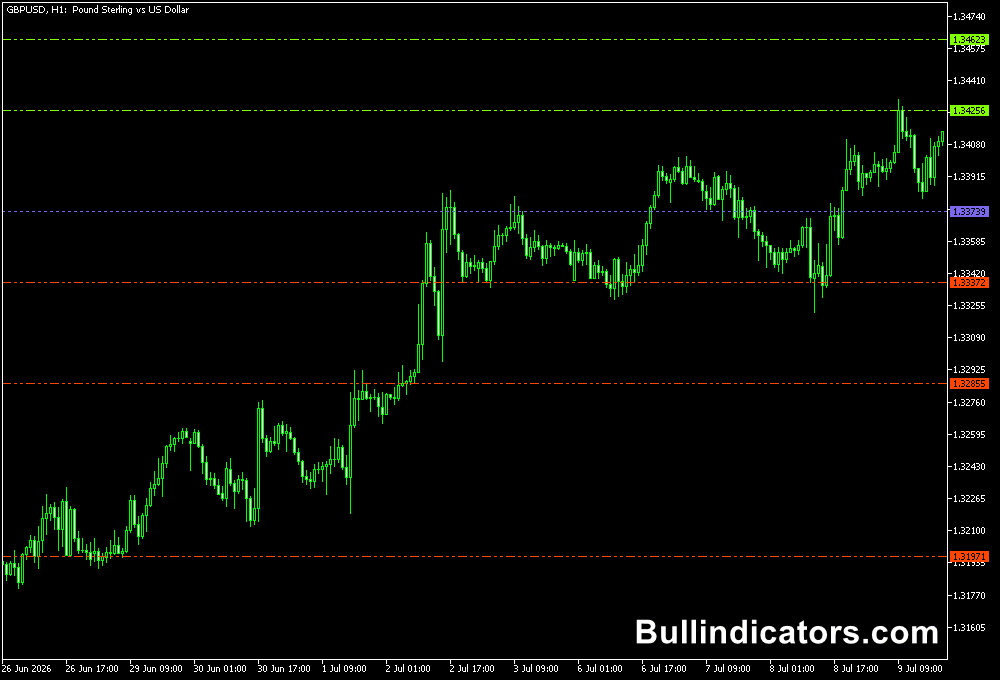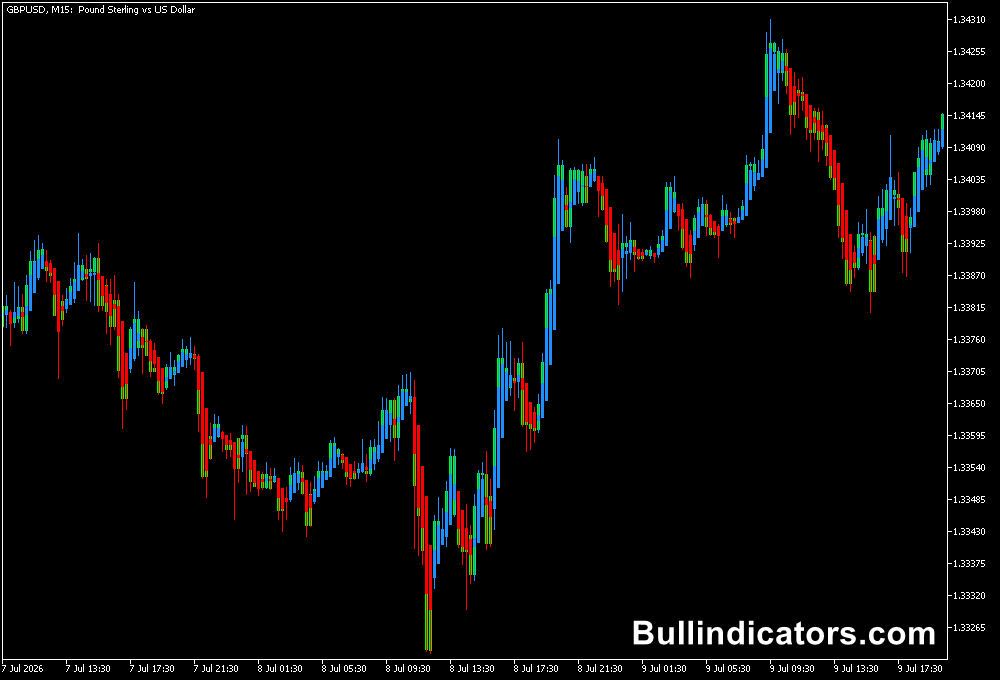
The Patterns indicator for MT5 is a price action tool that automatically identifies several one-bar, two-bar and three-bar formations directly on the chart.
It is designed to simplify the process of finding potential bullish and bearish setups without manually scanning every candlestick formation.
The indicator groups its signals into bullish, bearish and non-directional patterns.
Among the formations it can identify are DBLHC, DBHLC, BUOVB, BEOVB, TMHTB, TMLTB, IB4 and KEYRV.
This makes the indicator useful for studying market reversals as well as continuation opportunities around important price levels.
Why traders use Patterns Indicator
Price action analysis can require considerable chart observation, particularly when several candlesticks need to be compared.
Patterns Indicator automatically highlights recognized formations, allowing users to focus on where the signal occurs and whether the surrounding market structure supports the setup.
A pattern generally becomes more useful when it appears at a meaningful technical area.
Support, resistance, Fibonacci retracement levels and established swing points can provide additional context.
The indicator can therefore be combined with other technical tools rather than being used as a standalone entry trigger.
Download This MT5 Indicator for Free
Indicator Chart Setup
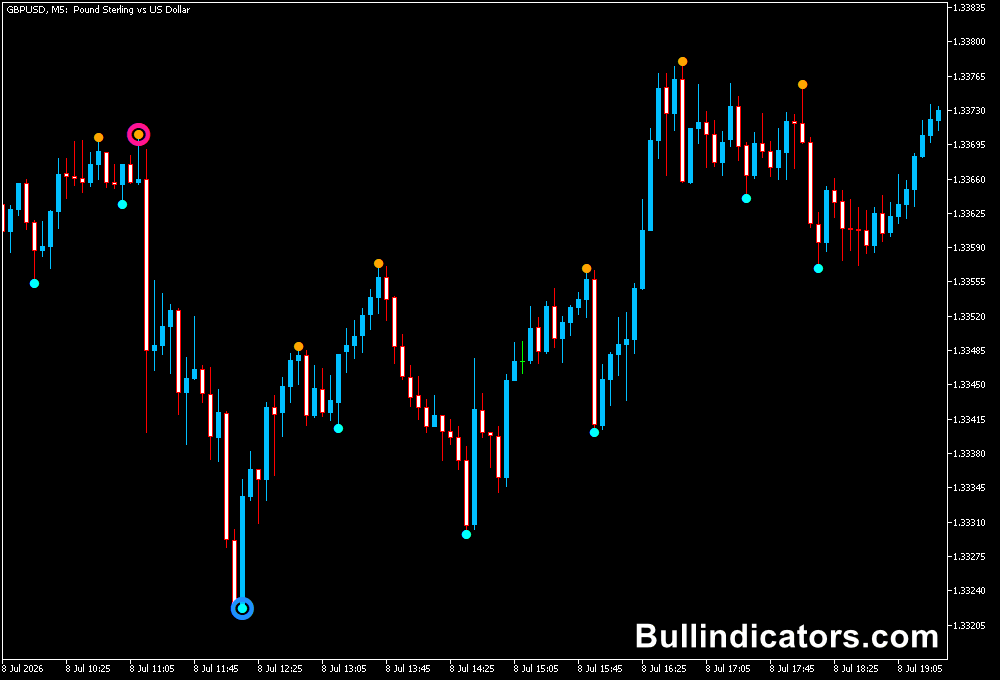
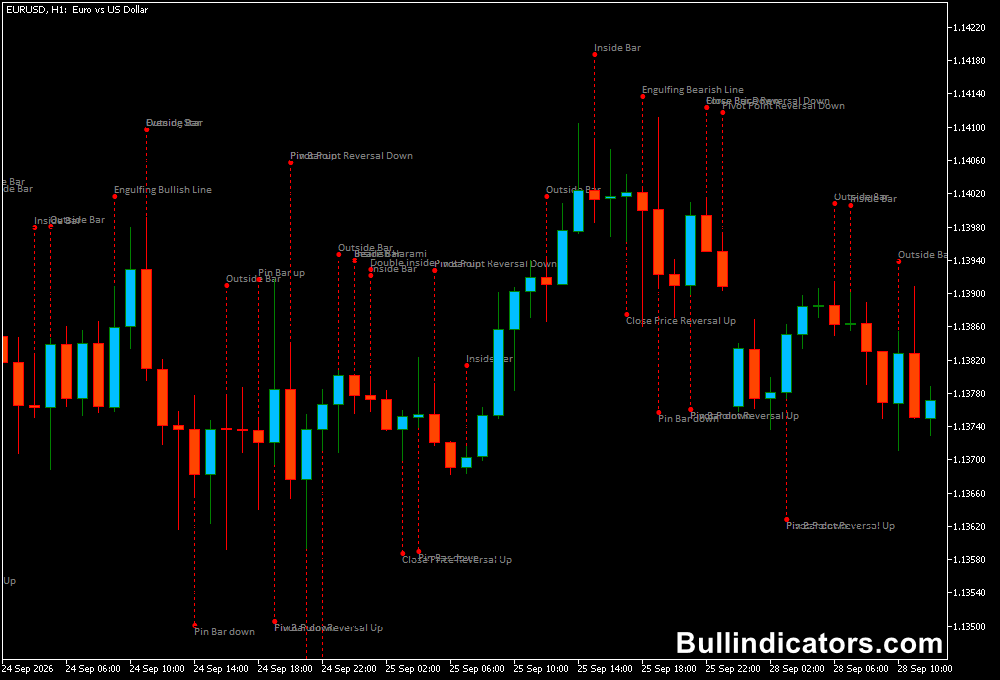
Patterns Indicator works directly on the MT5 price chart and marks recognized formations around the relevant candlesticks.
Bullish patterns can highlight potential upward moves, while bearish formations can point to possible downward movements.
Non-directional patterns provide additional information without assigning an immediate bullish or bearish bias.
For example, a bullish DBLHC appearing close to established support can draw attention to a possible upward reaction.
A bearish BEOVB forming near resistance can provide the opposite type of setup.
Confirmation from the surrounding price structure can help determine whether the pattern has sufficient context for an entry.
Core Features
- Automatic recognition of multiple price action formations
- Bullish, bearish and non-directional pattern categories
- Support for one-bar, two-bar and three-bar patterns
- DBLHC, DBHLC, BUOVB and BEOVB pattern detection
- TMHTB and TMLTB pattern detection
- IB4 and KEYRV non-directional patterns
- Individual pattern visibility controls
Best for
- Price action-based market analysis
- Finding potential reversal formations
- Confirming setups around support and resistance
- Combining candlestick patterns with trend indicators
- Reducing the time required to scan charts manually
Best Markets
- EURUSD for structured price action around major intraday support and resistance.
- GBPUSD for M15 and H1 pattern setups during active European and US sessions.
- USDJPY for identifying reversal formations around established swing levels.
- GBPJPY for larger price-action movements on M15, H1 and H4.
- XAUUSD for studying stronger candlestick formations around significant technical zones.
Trading Styles
- Scalping on M5 and M15 when patterns form near short-term support or resistance.
- Intraday trading on M15 and H1 using patterns with the prevailing market direction.
- Swing trading on H4 and D1 around major market structure.
- Multi-timeframe trading using H1 for trend direction and M15 for pattern-based entries.
How traders use it
A practical approach is to treat the pattern as an entry alert and then examine the technical environment around it.
A bullish formation at support has a different context from the same formation appearing in the middle of a strong bearish move.
Combining the signal with a trend filter can therefore make the analysis more selective.
How does it work?
One useful combination is the Patterns Indicator with the Ichimoku Indicator for MT5.
A straightforward trend approach is to monitor whether price is above or below the Ichimoku cloud.
Price above the cloud indicates a bullish environment, while price below the cloud indicates a bearish environment.
The Tenkan-sen and Kijun-sen can then be used to assess momentum and continuation.
For example, consider EURUSD on the M15 chart.
If price is above a bullish Ichimoku cloud and the Tenkan-sen is above the Kijun-sen, a bullish pattern from the Patterns Indicator near a pullback support area can provide a potential continuation setup.
A DBLHC or BUOVB signal in that location can be considered after the pattern candle closes.
For a bearish setup, price below the cloud combined with a bearish Tenkan-sen/Kijun-sen configuration can provide the directional context.
A BEOVB or TMLTB appearing near resistance may then be examined for a short entry.
This combination keeps the pattern responsible for the price-action trigger while the Ichimoku structure provides the broader directional context.
Get Instant Free Access
Indicator Settings
- Enables One-bar patterns: Enables or disables one-bar pattern detection.
- Enables Two-bar patterns: Enables or disables two-bar pattern detection.
- Enables Three-bar patterns: Enables or disables three-bar pattern detection.
- Show DBHLC: Enables or disables DBHLC signals.
- Show BEOVB: Enables or disables BEOVB signals.
- Show TMLTB: Enables or disables TMLTB signals.
- Show DBLHC: Enables or disables DBLHC signals.
- Show BUOVB: Enables or disables BUOVB signals.
- Show TMHTB: Enables or disables TMHTB signals.
- Show IB4: Enables or disables IB4 non-directional patterns.
- Show KEYRV: Enables or disables KEYRV non-directional patterns.
Important Notes
- A detected pattern is a technical setup, not a guarantee that price will reverse or continue.
- Pattern location is important; signals near established support, resistance or Fibonacci levels can provide more useful context.
- Higher-timeframe market structure can help filter lower-timeframe signals.
- Wait for the relevant candle or pattern to complete before making an assessment.
- Stop-loss placement should account for the recent swing structure and volatility of the selected market.
- Test the indicator with your preferred trading approach before using it with live capital.