The ZigZag Fibo indicator for MT5 combines ZigZag swing analysis with automatic Fibonacci retracement levels to help identify potential pullback entries.
The ZigZag component highlights significant market highs and lows, while the Fibonacci levels are drawn between the detected swing points.
This creates a simple framework for following a trend and looking for entries when price retraces.
The indicator can be used across different timeframes, from short-term intraday charts to higher timeframes for longer-term analysis.
EURUSD on the M15 chart provides a practical environment for studying the relationship between market structure, Fibonacci retracements and continuation moves.
Why traders use ZigZag Fibo
ZigZag Fibo brings two commonly used technical analysis techniques together in one chart tool.
The ZigZag helps identify the current sequence of significant highs and lows, while the automatically plotted Fibonacci levels provide reference points during a correction.
This combination can make pullback analysis easier because the Fibonacci levels are based on the swing points identified by the ZigZag.
Users can then look for price action confirmation around the retracement levels instead of entering simply because price has reached a particular percentage.
Download This MT5 Indicator for Free
Indicator Chart Setup
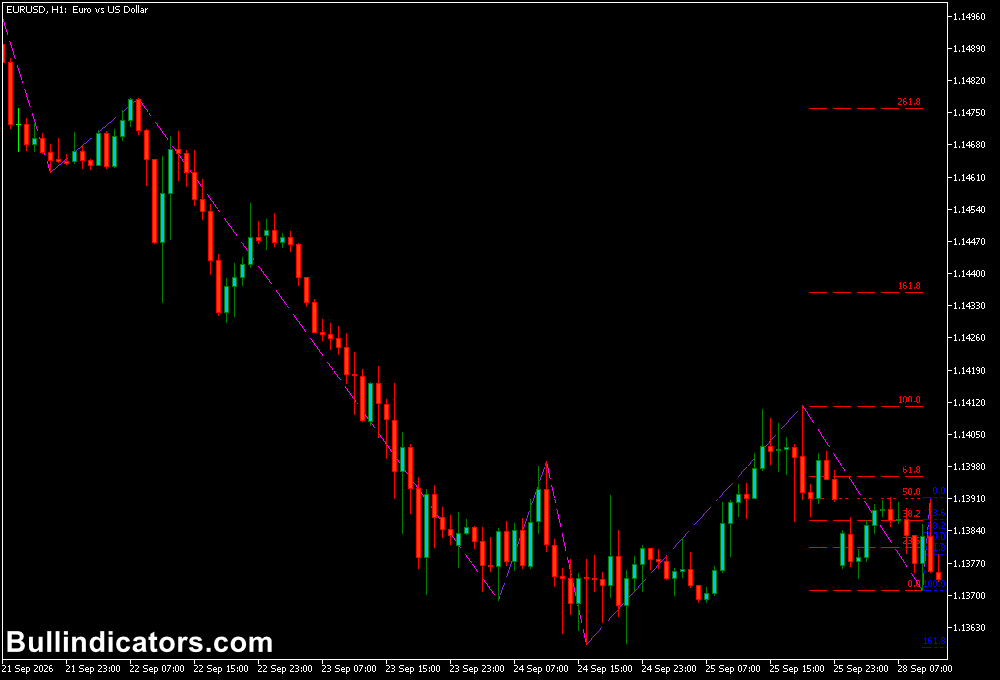
ZigZag Fibo is applied directly to the MT5 price chart.
The ZigZag connects important swing highs and lows, and once a suitable high and low are identified, the indicator automatically plots Fibonacci retracement levels between them.
During an uptrend, the Fibonacci levels can be used to monitor a downward correction before a potential continuation higher.
During a downtrend, the levels provide reference areas where an upward retracement may encounter resistance.
Core Features
- Automatic ZigZag swing detection
- Automatic Fibonacci retracement plotting
- Adjustable ZigZag depth, deviation and backstep
- Customizable Fibonacci line color, width and style
- Selectable Fibonacci levels
- Optional Fibonacci level masking
- Option to reverse the 100 and 0 Fibonacci levels
Best for
- Trend continuation after market pullbacks
- Identifying potential retracement entry zones
- Combining swing structure with Fibonacci analysis
- Intraday support and resistance analysis
- Multi-timeframe market structure analysis
Best Markets
- EURUSD for clean M15 and H1 pullback analysis.
- GBPUSD when strong directional moves create clearly defined swings.
- USDJPY for intraday retracement setups around established market structure.
- GBPJPY for larger swing movements where Fibonacci pullbacks can provide useful reference areas.
- Major Forex pairs with sufficient liquidity and directional movement.
Trading Styles
- Intraday pullback trading on M15 and H1.
- Short-term trend continuation on M5 and M15.
- Swing trading on H4 and D1.
- Multi-timeframe analysis using H1 for trend direction and M15 for entries.
How traders use it
A straightforward approach is to first establish whether the ZigZag is showing a sequence of higher highs and higher lows or lower highs and lower lows.
The Fibonacci levels can then be used to monitor the next retracement.
A trade should not be based on the Fibonacci level alone; price action around the level can provide additional confirmation.
For example, the M15 EURUSD chart can be used to identify short-term directional moves while keeping the H1 chart available for broader context.
EURUSD M15 Buy Example
- Open EURUSD on the M15 chart and identify an upward ZigZag structure with a higher swing high and higher swing low.
- Wait for the indicator to plot Fibonacci levels across the latest significant upward swing.
- Allow price to retrace toward one of the first Fibonacci levels rather than buying while price is still extending upward.
- Watch for bullish confirmation, such as a rejection wick followed by a bullish M15 candle close.
- Consider a buy entry after the confirmation candle closes.
- Place the stop loss below the recent ZigZag swing low or below the retracement structure that invalidates the setup.
- Use the previous high, the 100% Fibonacci area or a predefined risk-to-reward target as an exit reference.
- For example, if EURUSD pulls back 12 pips to a Fibonacci level and then rallies 25 pips, the position could be managed toward the previous swing high.
EURUSD M15 Sell Example
- Identify a bearish ZigZag structure with lower highs and lower lows.
- Allow the market to retrace upward toward the automatically plotted Fibonacci levels.
- Wait for price to reach a relevant retracement level and show bearish rejection.
- A bearish M15 candle closing below the preceding candle can provide confirmation for a short entry.
- Place the stop loss above the recent ZigZag swing high or above the level that invalidates the bearish setup.
- Set the profit target near the previous swing low or use the next significant support area.
- For example, if EURUSD retraces 15 pips upward before rejecting resistance and subsequently falls 30 pips, the move can provide room for a short position to develop.
- If price breaks above the ZigZag swing high instead, the bearish setup is invalidated and the position should be managed according to the predefined risk plan.
Get Instant Free Access
Indicator Settings
- ExtDepth: Controls the depth used in the ZigZag calculation.
- ExtDeviation: Sets the deviation parameter used to identify significant ZigZag movements.
- ExtBackstep: Controls the backstep setting for ZigZag swing calculations.
- FiboLineColor: Selects the color of the Fibonacci lines.
- FiboLineWidth: Controls the thickness of the Fibonacci lines.
- FiboLineStyle: Sets the visual style of the Fibonacci lines.
- FiboLevels: Defines the Fibonacci levels displayed by the indicator.
- FiboMask: Controls the Fibonacci level marking configuration.
- Reverse100and0: Reverses the 100 and 0 Fibonacci levels.
Important Notes
- The ZigZag is based on significant price movements and its latest swing can change as new price information develops.
- Fibonacci levels should be treated as reference areas rather than guaranteed reversal points.
- On the M15 EURUSD chart, confirmation from price action can help filter weak pullbacks.
- A break beyond the relevant ZigZag swing can invalidate the original trend-continuation setup.
- Stop-loss placement should account for current volatility and the structure of the selected market.
- Test the indicator and its settings before using it with live capital.