
The RSI Heatmap indicator for MT4 is a currency strength analysis tool that uses the Relative Strength Index (RSI) to measure the momentum and strength of multiple currency pairs.
Instead of analyzing one chart at a time, the indicator provides a complete overview of different currencies and timeframes through a color-based heatmap.
The heatmap allows users to quickly identify currencies gaining strength and those losing momentum.
By monitoring RSI values across several pairs, traders can compare market conditions and find potential opportunities where strong currencies meet weak ones.
This type of analysis is especially useful for traders who prefer currency strength strategies, as it provides a broader market perspective before entering individual trades.
Why traders use the RSI Heatmap Indicator
Currency strength plays an important role in forex trading because every currency pair compares one currency against another.
A strong currency combined with a weak currency can create a clearer directional opportunity compared with trading random pairs.
The RSI Heatmap simplifies this process by converting RSI calculations into easy-to-read colors.
Users can immediately identify whether a currency is showing strong bullish momentum, weak bullish conditions, weak bearish movement, or strong bearish pressure.
Another advantage is the multi-timeframe view.
Instead of switching between many charts, users can monitor several timeframes from one dashboard and look for alignment between short-term and longer-term momentum.
Download This MT4 Indicator for Free
Indicator Chart Setup
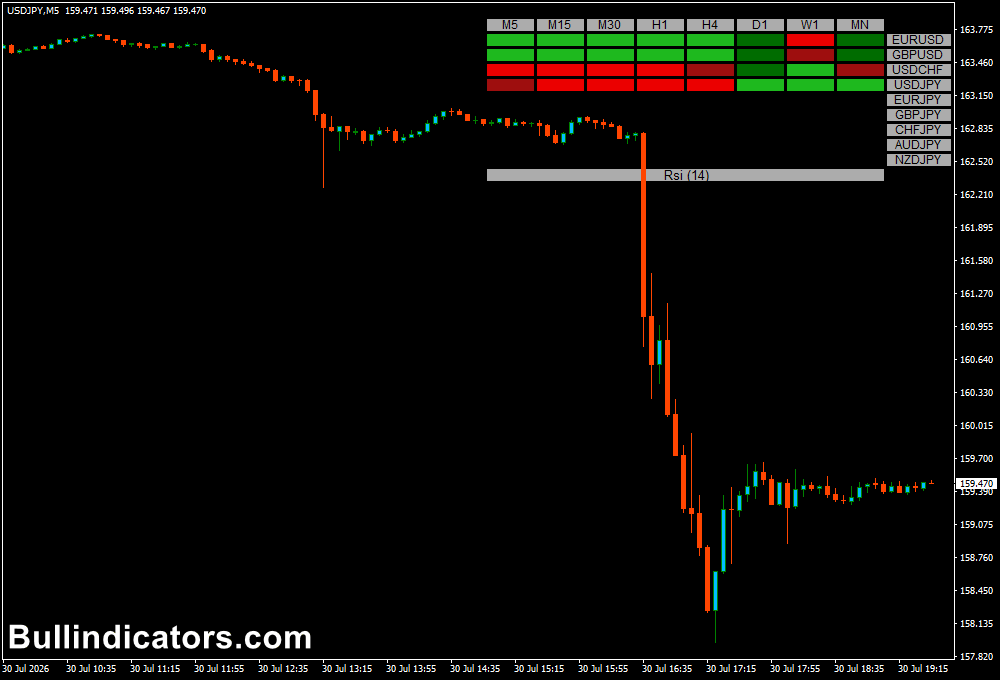
The RSI Heatmap creates a dashboard displaying selected currency pairs and timeframes.
Each section receives a color based on RSI strength and market direction, allowing users to quickly compare currency momentum.
Green and lime green colors represent improving bullish strength, while fire brick and red colors highlight weakening or bearish conditions.
These color changes can help identify when momentum shifts from weak to strong or from strong to weak.
For example, if GBP shows lime green readings across multiple timeframes while JPY displays red conditions, the GBP/JPY pair may deserve further analysis because the strength difference between both currencies is visible.
Core Features
- Measures currency strength using RSI calculations
- Displays multiple currency pairs in a heatmap format
- Supports multiple timeframe analysis
- Uses color changes to identify momentum shifts
- Helps compare strong and weak currencies quickly
- Provides a simple dashboard-style market overview
Best for
- Finding strong and weak currency combinations
- Confirming momentum before entering trades
- Monitoring multiple forex pairs efficiently
- Supporting currency strength trading strategies
- Filtering lower-quality trading opportunities
Best Markets
- Major forex pairs such as EUR/USD, GBP/USD, and USD/JPY
- Cross pairs like GBP/JPY and EUR/GBP where strength differences are visible
- Currency baskets requiring broader market comparison
- Highly liquid pairs during London and New York sessions
- Short-term forex markets where momentum changes quickly
Trading Styles
- Scalping on M1 to M15 charts
- Intraday momentum trading
- Day trading using multi-timeframe confirmation
- Currency strength-based strategies
- Trend-following approaches with additional confirmation
How traders use it
The RSI Heatmap should generally be used in the direction of the main market trend.
Strong RSI readings can remain elevated during powerful trends, so taking every color change as a reversal signal can create unnecessary losses.
A practical approach is to first determine the overall trend and then use the heatmap to improve entry timing.
For example, if the daily and H4 charts show a bullish EUR/USD trend, users can focus on BUY opportunities when the RSI Heatmap shows EUR strength increasing and USD weakness appearing.
Practical Example with Super Arrow Indicator
The indicator can also be combined with a trend confirmation tool such as the Super Arrow Buy Sell Indicator for MT4.
A simple strategy is to follow the Super Arrow direction first: a green arrow indicates a possible BUY trend, while a red arrow indicates a possible SELL trend.
BUY
For example, if the Super Arrow displays a green BUY arrow on EUR/USD, and the RSI Heatmap changes from green to lime green across M5 and M15 timeframes, this creates a stronger bullish confirmation.
A trader can then look for a short-term entry and target approximately 10 to 30 pips depending on the timeframe, market volatility, and currency pair.
Lower timeframes such as M1 and M5 may aim for smaller targets, while M15 setups can allow wider price movements.
SELL
For SELL opportunities, the opposite approach applies.
A red Super Arrow signal combined with RSI Heatmap colors changing from fire brick to red can confirm increasing bearish pressure.
This keeps trades aligned with momentum rather than fighting the market direction.
Get Instant Free Access
Indicator Settings
- Symbols to Use: Defines which currency pairs are displayed in the heatmap. Users can enter specific pairs to monitor their preferred markets.
- Time Frames to Use: Selects the timeframes included in the dashboard, allowing comparison between short-term and higher timeframe momentum.
- RSI Period: Controls the RSI calculation period. A lower value reacts faster to price changes, while a higher value provides smoother readings.
- RSI Price: Determines which price type is used for RSI calculations, such as close price or other available price inputs.
- Strong Up Level: Defines the RSI value considered strong during bullish movement.
- Weak Up Level: Sets the RSI threshold for weaker bullish conditions.
- Weak Down Level: Determines the RSI value representing weaker bearish momentum.
- Strong Down Level: Defines the RSI level used to identify strong bearish conditions.
Important Notes
- The RSI Heatmap works best when combined with trend analysis.
- A strong RSI reading does not automatically mean price will continue moving in one direction.
- Avoid trading against the main trend without additional confirmation.
- Multiple timeframe agreement can improve signal quality.
- Always apply proper risk management because market momentum can change quickly.









