
The Target Bands Indicator for MT4 is a channel-based technical tool designed to highlight areas where price may become exhausted and potentially reverse.
It plots upper and lower bands around the market, creating visual reference zones for overbought and oversold conditions.
Price reaching or moving beyond either band can signal that the current move is becoming extended.
The indicator also marks potential entries with stars, giving users a straightforward way to combine the band location with price action and other technical confirmation.
With its default 55-bar look-back calculation and adjustable parameters, the Target Bands Indicator can be adapted to different markets and timeframes.
It is particularly useful for short-term setups, although the same concept can be applied to broader intraday analysis.
Why traders use the Target Bands Indicator
The upper and lower bands provide clearly defined areas to watch when price makes an unusually strong move.
A touch or break beyond a band does not automatically mean a reversal will occur, but it can draw attention to a location where exhaustion or a reaction may develop.
The tool becomes more useful when combined with price action.
For example, repeated wick rejections outside a band followed by a reversal candle can provide stronger evidence than the band signal alone.
The stars also make potential BUY and SELL areas easy to spot without adding several separate tools to the chart.
Its sensitivity makes it suitable for active markets where short-term extensions and pullbacks occur frequently.
Download This MT4 Indicator for Free
Indicator Chart Setup
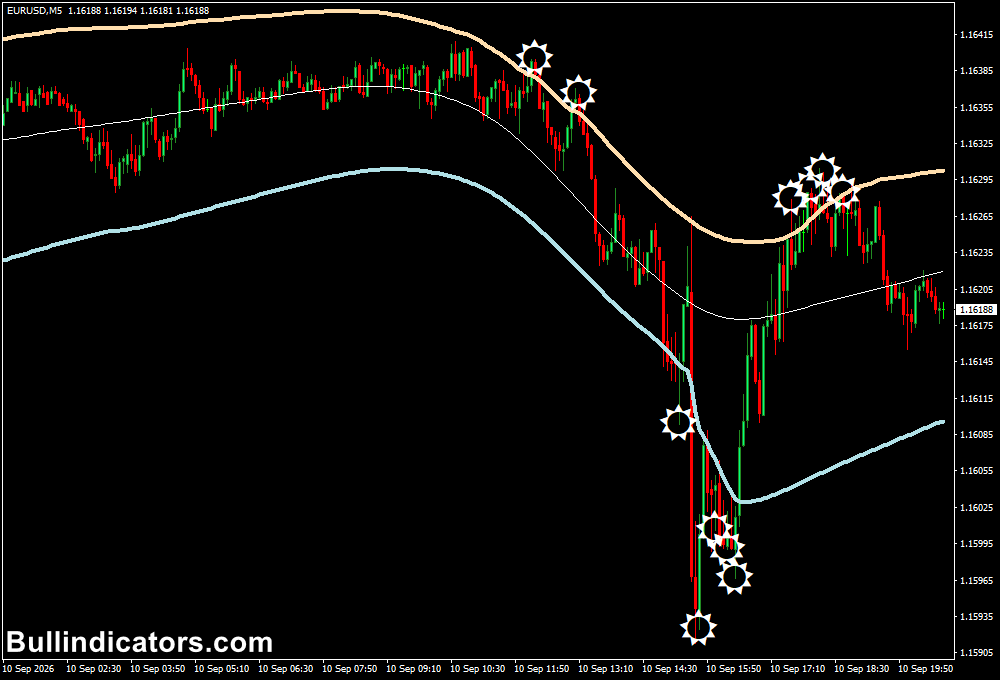
The Target Bands Indicator draws an upper and lower channel around price.
The upper band represents an area where bullish movement may become extended, while the lower band highlights a zone where selling pressure may be reaching an extreme.
BUY and SELL stars identify potential reversal entries.
Price can also move outside a band during strong trends, so the location of the signal should be assessed together with candle structure, support and resistance, and the prevailing market direction.
Core Features
- Upper and lower target bands
- Potential overbought and oversold zones
- BUY and SELL star signals
- Adjustable look-back calculation
- Customizable band deviation
- Multi-timeframe analysis
- Optional signal alerts
Best for
- Spotting potential price exhaustion
- Reversal setups following extended moves
- Monitoring breakouts beyond established bands
- Combining channel levels with candlestick confirmation
Best Markets
- EURUSD for short-term intraday reversal setups
- GBPUSD during active London and New York sessions
- USDJPY when clear intraday ranges develop
- GBPJPY for larger volatility and fast price extensions
- XAUUSD for experienced users comfortable with wider movements
Trading Styles
- Scalping on M1, M5 and M15
- Intraday reversal trading on M15 and M30
- Range trading around established support and resistance
- Breakout-retest strategies using the bands as reference levels
How traders use it
A useful method is to treat the bands as areas of interest rather than automatic entry levels.
When price reaches an extreme, look for evidence that momentum is weakening before taking a position.
EURUSD M5 Buy Example
- EURUSD is trading on the M5 chart and price makes a sharp bearish move toward the lower Target Band.
- The price briefly breaks below the lower band, showing that the decline has become extended.
- Several candles produce lower wicks below the band, indicating repeated rejection of lower prices.
- A BUY star appears as price begins moving back toward the channel.
- A bullish engulfing candle provides additional price-action confirmation.
- A BUY position can be considered after the confirmation candle closes.
- The stop loss can be positioned below the recent rejection low.
- The first target can be the middle of the band structure, with a larger target toward the opposite side of the channel if momentum continues.
EURUSD M5 Sell Example
- Price rallies strongly toward the upper Target Band.
- The market pushes beyond the upper band but begins producing rejection wicks.
- A SELL star appears as price starts moving back inside the channel.
- A bearish reversal candle can be used as additional confirmation.
- A short position can be considered after the candle closes.
- The recent swing high provides a logical reference for the stop loss.
- Potential targets include the channel midpoint or a lower support area.
The same principle can be combined with a moving average for trend context, RSI for momentum confirmation, or horizontal support and resistance for stronger entry locations.
For breakout trading, a sustained move outside a band should be treated differently from a quick spike followed by rejection.
Get Instant Free Access
Indicator Settings
- Timeframe – defines the timeframe used for the analysis.
- Half length – sets the number of look-back bars used for the calculation.
- Price – determines the price period used for signal calculation.
- Bands deviation – controls the deviation value of the bands.
- Interpolate – enables or disables automatic adjustment when working with multiple timeframes.
- Alerts on – enables or disables signal alerts.
Important Notes
- A band touch or breakout does not guarantee an immediate reversal.
- Strong trends can remain outside the bands for extended periods.
- Price-action confirmation can help filter weaker reversal signals.
- Adjust the settings according to the currency pair and timeframe.
- Use a defined stop loss and appropriate position sizing for every setup.









