
The Volatility Quality indicator for MT4 combines market volatility and trend strength into a single chart window.
It presents the calculated market condition as a changing line and can highlight potential BUY and SELL opportunities with colored arrows and alerts.
One of its useful characteristics is the ability to reference different timeframes while working from the same chart.
This makes it suitable for a top-down approach, where higher-timeframe volatility and direction are assessed before looking for entries on a lower timeframe.
Why traders use the Volatility Quality Indicator
Volatility can change rapidly between quiet consolidation and strong directional movement.
Having a visual representation of these changes can help decide whether conditions are more suitable for continuation trades, breakouts, or shorter-term setups.
The line remains lime while bullish conditions persist and changes to red during bearish phases.
Arrow signals provide additional entry references, while alerts can notify you when a new signal develops.
The customizable calculation also allows the settings to be adapted to different currency pairs and trading timeframes.
Another advantage is its multi-timeframe capability.
A higher timeframe can be monitored for the broader volatility environment while a lower timeframe is used to refine the actual trade setup.
Download This MT4 Indicator for Free
Indicator Chart Setup
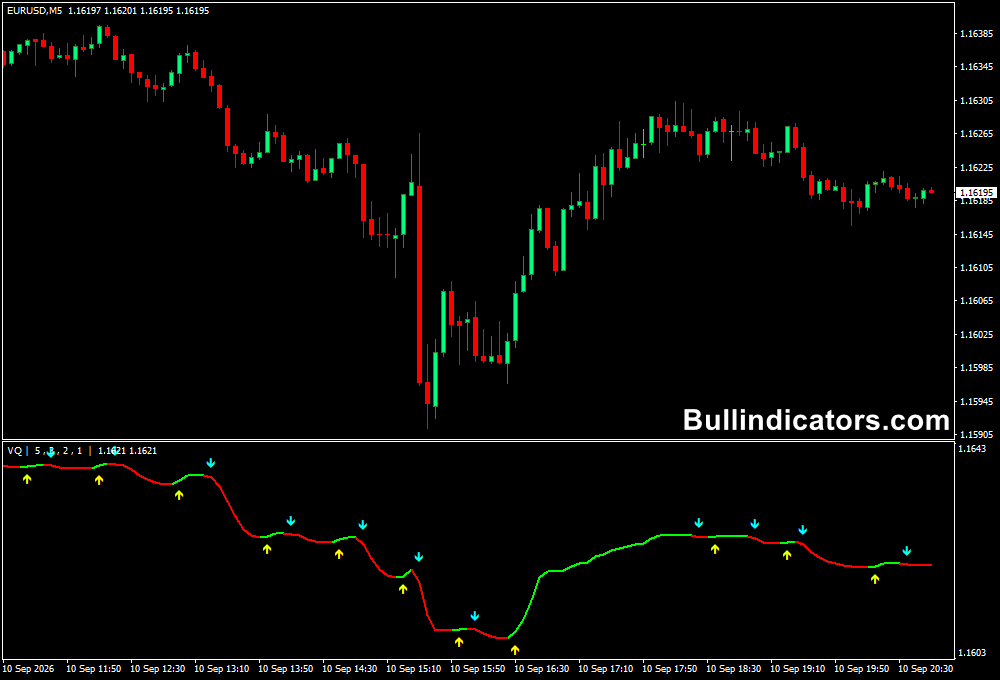
The Volatility Quality indicator appears in a separate window underneath the main price chart.
Its line changes color based on the detected market direction, with lime indicating bullish conditions and red indicating bearish conditions.
BUY and SELL arrows can appear when the calculation produces a corresponding signal.
Signal prices may also be displayed, making it easier to identify the approximate level where the alert was generated.
The presentation remains relatively simple while providing several useful pieces of information for volatility-based analysis.
Core Features
- Combines volatility and trend-strength analysis
- Lime and red line colors for directional conditions
- BUY and SELL arrow signals
- Real-time signal processing
- Customizable smoothing and filtering
- Multi-timeframe analysis capabilities
- Visual, sound and email alert options
- Optional signal-price display
Best for
- Identifying changes in market volatility
- Following directional market phases
- Filtering breakout opportunities
- Top-down multi-timeframe analysis
- Planning entries around changing volatility conditions
Best Markets
- USDJPY and EURUSD for liquid trend and breakout conditions
- GBPJPY when stronger volatility creates larger directional moves
- AUDUSD and NZDUSD during active session movements
- XAUUSD for volatility-focused analysis when wider price swings are acceptable
Trading Styles
- Scalping with M1, M5 and M15 signal confirmation
- Intraday trend trading on M15, H1 and H4
- Breakout strategies around volatility expansion
- Swing setups using Daily and Weekly market direction
How traders use it
The Volatility Quality Indicator can be used on its own for directional analysis, but combining its information with complementary tools can create more selective setups.
A useful method is to use a higher timeframe to establish the market environment and then wait for a lower-timeframe signal that agrees with it.
Volatility Quality + Moving Average
A moving average can provide a simple trend filter while Volatility Quality identifies changes in volatility and directional pressure.
For example, long setups can be considered when price is above a rising moving average and the line turns or remains lime.
Short setups can be evaluated when price is below a declining average while the line remains red.
Volatility Quality + Support and Resistance
Key price levels can be used to give context to the arrows.
A bullish signal appearing near established support can be more interesting than the same signal in the middle of a trading range.
Similarly, a bearish signal near resistance can provide a logical area for further confirmation.
Volatility Quality + Breakout Trading
During consolidation, traders can mark the range high and low and wait for volatility to expand.
A bullish arrow combined with a move above resistance can support a breakout setup, while a bearish arrow accompanied by a break below support can be used for a downside scenario.
Multi-Timeframe Combination
A practical top-down setup can use H4 for the main market direction, H1 for trend confirmation and M15 for the entry.
This approach helps prevent a lower-timeframe signal from being considered in isolation from the broader market environment.
Get Instant Free Access
Indicator Settings
- Method – selects the moving average calculation method.
- Smoothing – controls the smoothing period.
- Filter – applies additional signal filtering.
- RealTime – enables real-time signal processing.
- Steady – provides additional smoothing for the output.
- Color – sets the color of the volatility quality line.
- Alerts – enables signal alerts.
- EmailON – sends signals by email.
- SignalPrice – displays the price where a signal was generated.
- SignalPriceBUY – sets the BUY signal-price color.
- SignalPriceSELL – sets the SELL signal-price color.
Important Notes
- Volatility conditions can change quickly, particularly around major economic releases.
- Settings may need adjustment depending on the currency pair and timeframe.
- Signals should be confirmed with price structure and the broader market direction.
- Sideways markets can produce less reliable directional signals.
- Higher-timeframe analysis can help filter weaker lower-timeframe setups.
- Use appropriate position sizing and a defined stop loss with every trade.









