
The Zero Lag Moving Average indicator for MT4 is a responsive moving average designed to follow price more closely than conventional moving averages.
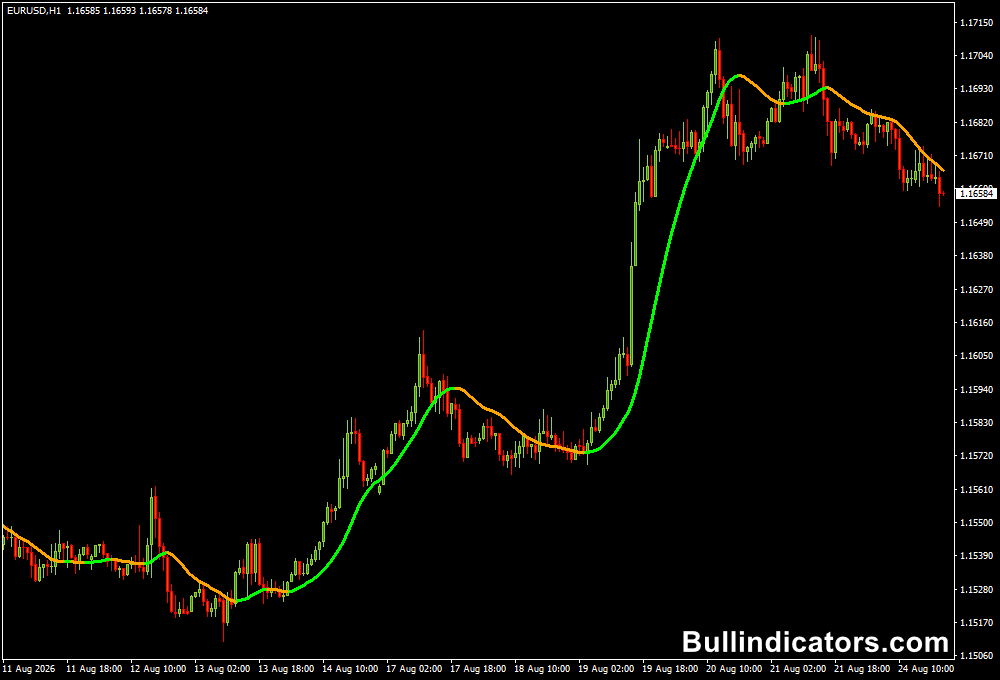
Its color changes provide an additional trend reading: green represents bullish conditions, while orange indicates a bearish bias.
This makes the tool useful for filtering market direction before looking for an entry.
It can also be combined with a second Zero Lag Moving Average using a different period.
A shorter line reacts faster to price, while a longer line provides a broader view of the prevailing trend.
The combination can be particularly effective for short-term Forex trading.
Why traders use the Zero Lag Moving Average
Traditional moving averages are valuable, but their calculations can leave the line noticeably behind fast price movements.
This version is designed to reduce that delay while retaining the smoothing characteristics that make moving averages useful.
The color transition adds another layer of information.
A green line suggests that bullish pressure is developing, whereas an orange line points toward bearish conditions.
Watching the line together with price location can help avoid entering simply because a single candle moved sharply.
Using two different periods is a practical way to create a simple trend filter.
When the shorter average is above the longer average and both are green, bullish setups have stronger support.
The opposite combination can be used when looking for short positions.
Download This MT4 Indicator for Free
Indicator Chart Setup
The Zero Lag Moving Average is plotted directly over the candles.
The line changes between green and orange as its calculated market bias changes.
Price moving above a green line can support a bullish setup, while sustained trading below an orange line can favor bearish positions.
For faster trading, two copies can be placed on the same chart with different Hull periods.
A shorter setting can be used for entry timing and a longer setting as the directional filter.
This creates a straightforward way to distinguish a temporary pullback from a broader trend move.
Core Features
- Responsive moving-average calculation designed to reduce lag.
- Green line for bullish conditions.
- Orange line for bearish conditions.
- Multiple calculation and filtering options.
- Suitable for scalping, intraday and swing analysis.
- Alert functionality can be enabled from the settings.
Best for
- Filtering the general market direction.
- Identifying trend transitions.
- Timing entries after pullbacks.
- Combining short and long trend measurements.
- Following directional moves without relying on a single candle.
Best Markets
- EURUSD for highly liquid intraday setups.
- GBPUSD when momentum increases during active sessions.
- USDJPY for directional M5 and M15 trading.
- GBPJPY for experienced scalpers comfortable with larger price swings.
- Gold (XAUUSD) when the market develops a sustained intraday trend.
Trading Styles
- Scalping on M1 and M5 charts.
- Intraday momentum trading on M15 and M30.
- Trend-following on H1 and H4.
- Pullback trading using two different moving-average periods.
How traders use it
A useful setup uses one faster and one slower Zero Lag Moving Average.
For example, the shorter average can identify changes in the immediate direction, while the longer average determines whether the market is broadly bullish or bearish.
EURUSD example on M5 charts
Consider EURUSD on M5. The longer average is green and price remains above it, establishing a bullish environment.
A temporary pullback pushes price toward the shorter average.
Once the shorter line turns green again and price prints a bullish candle, a BUY can be considered.
A stop can be placed below the recent swing low, with the next resistance area used as a target.
On the same day, suppose this approach produces three successful EURUSD M5 trades of 12, 18 and 15 pips.
That would give a total of 45 pips for the day.
This is an example of how a dual-average approach can provide several opportunities without taking positions against the broader direction.
Actual results will vary with market conditions and execution.
M15 example
For an M15 example, the longer average can be used to identify the dominant direction while the shorter one handles entry timing.
Imagine both averages are orange and price is trading below them.
A rally toward the faster line creates a potential pullback setup.
If sellers return and the shorter average turns orange again, a SELL can be considered with protection above the recent swing high.
The next support zone can provide the first profit objective.
Get Instant Free Access
Indicator Settings
- Hull period – Sets the calculation period.
- Price to use – Selects the price type used by the calculation.
- Hull divisor – Determines the divisor used in the calculation.
- Hull average type – Selects the moving-average calculation type.
- Filter to use for filtering – Controls the filtering value.
- The filter should be applied to – Determines where the filter is applied.
- Display type – Controls how the average is displayed.
- Hull shift – Adjusts the position of the line on the chart.
- Line width – Sets the thickness of the plotted line.
- Turn alerts on – Enables or disables the alert system.
Important Notes
- The fastest settings can react quickly but may also produce more changes during sideways markets.
- A longer average is useful for keeping short-term trades aligned with the broader direction.
- When the two averages disagree, waiting for alignment can help reduce counter-trend entries.
- Price action around support and resistance remains important when deciding where to enter and exit.
- Use a defined stop loss and consistent position sizing; a moving average cannot eliminate trading risk.









