
The Non Lag Dot Non Repaint indicator for MT4 uses changing colored dots to show the current market direction and potential trend reversals.
Green dots indicate bullish conditions, while red dots point to bearish conditions.
The straightforward presentation makes it useful for beginners, while the non-repaint design also makes it suitable for more advanced technical setups.
The tool can be used across different timeframes and markets.
Its strongest application is often found when the directional reading is combined with price action and a second confirmation tool.
This becomes particularly useful on fast charts, where a sequence of small moves can otherwise make it difficult to distinguish a genuine reversal from temporary market noise.
Why traders use the Non Lag Dot Non Repaint Indicator
The main attraction is its simple interpretation.
A color change gives an immediate indication that the calculated market direction has shifted.
Green supports bullish conditions and red supports bearish conditions, allowing the user to concentrate on price location, entry timing and risk management.
Another useful characteristic is that the indicator is described as non-repainting.
Historical signals therefore remain available for reviewing previous setups and studying how the method behaves in different market conditions.
This can be valuable when developing a consistent trading routine.
For scalping, the dots can be paired with a reversal confirmation tool to reduce the number of premature entries.
One useful combination is the Lucky Reversal Indicator with Alert for MT4, where the blue arrow represents a bullish trend reversal and the red arrow represents a bearish trend reversal.
Download This MT4 Indicator for Free
Indicator Chart Setup
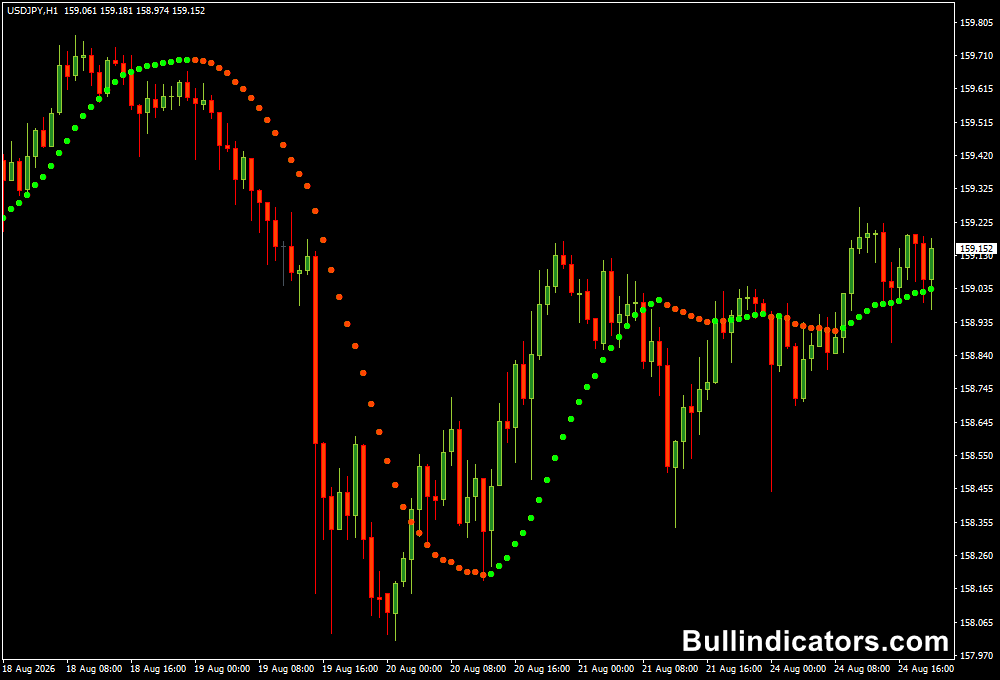
The dots appear directly around the price candles and change between green and red as the calculated direction changes.
Green dots suggest that buyers have the upper hand, while red dots indicate bearish pressure.
Pay attention to where a color change occurs.
A bullish change close to support can be more interesting than one appearing after an extended rally.
Likewise, a bearish change near resistance may offer a better short-term opportunity than a red signal in the middle of an established bullish move.
Core Features
- Green dots identify bullish market conditions.
- Red dots identify bearish market conditions.
- Designed as a non-repaint trading tool.
- Can be applied to different chart timeframes.
- Useful for trend-following and reversal analysis.
- Can be combined with another reversal confirmation system.
Best for
- Spotting changes in short-term market direction.
- Following established intraday trends.
- Filtering potential scalping entries.
- Top-down analysis across multiple timeframes.
- Confirming reversals around important price levels.
Best Markets
- USDCHF for structured intraday movements.
- EURUSD when liquidity is high during London and New York sessions.
- GBPUSD for faster momentum and reversal setups.
- USDJPY for short-term directional trades.
- XAUUSD for traders comfortable with larger intraday price swings.
Trading Styles
- Scalping on M1, M5 and M15.
- Intraday trend trading on M15 and M30.
- Short-term swing setups on H1 and H4.
- Multi-timeframe analysis for filtering counter-trend signals.
How traders use it
A practical approach is to start with the broader direction and then wait for a favorable dot change on the execution timeframe.
In a bullish market, green dots can be used to stay with long setups, particularly when price is pulling back toward support.
During bearish conditions, red dots can help identify areas where short positions may have better odds.
Real-scalping example
For scalping, combining the dots with the Lucky Reversal Indicator with Alert for MT4 can add another layer of confirmation.
A blue arrow signals a bullish reversal, while a red arrow signals a bearish reversal.
When both tools point in the same direction, the setup becomes more selective.
USDCHF
For example, consider USDCHF on the M1 chart.
Suppose the pair has been declining but reaches a support zone and begins showing signs of buying pressure.
The Non Lag Dot changes from red to green, followed by a blue bullish reversal arrow from the Lucky Reversal Indicator.
A scalper could consider a BUY after the confirmation candle closes.
The stop loss could sit below the recent swing low, with the first target near the next resistance area.
If price reaches that area quickly, partial profits can be taken while the remainder is managed with a trailing stop.
The reverse setup applies when USDCHF is rising into resistance.
A change from green to red together with a red bearish reversal arrow can provide a reason to consider a SELL.
The stop can be placed above the latest swing high, while the profit objective is based on the next support zone.
Get Instant Free Access
Indicator Settings
- Price – Determines the price method used in the calculation.
- Length – Controls the calculation length.
- Displace – Sets the displacement distance for the dots.
- Filter – Defines the filter length used by the calculation.
- Colors – Controls the appearance of the bullish and bearish dots.
Important Notes
- A green dot does not automatically mean that price will continue rising; consider the surrounding market conditions.
- A red dot appearing during a strong bullish trend can represent a temporary pullback rather than a major reversal.
- For scalping, use the general trend and nearby support or resistance to avoid chasing late signals.
- Signals become more useful when price location and a second confirmation agree with the dot color.
- Always define the stop loss before entering a position and keep the amount risked per trade under control.









