
The 3 Color MACD indicator for MT4 combines the traditional MACD signal line with a color-coded histogram to make changes in momentum easier to recognize.
The histogram changes between bullish and bearish colors, while the signal line provides additional crossover information.
This combination allows the tool to be used for several types of analysis.
The histogram can highlight changes in momentum before a conventional MACD zero-line crossover occurs, while the signal line and zero level can be used for confirmation.
It can also be applied to divergence analysis when price and MACD momentum move in different directions.
The 3 Color MACD is non-repainting and can be used on everything from very short-term M1 charts to higher timeframes for swing and position analysis.
Download This MT4 Indicator for Free
Why traders use the 3 Color MACD Indicator
The advantage of this version of MACD is that several pieces of momentum information are presented together.
The histogram provides an immediate view of whether momentum is strengthening or weakening, while the signal line offers a more traditional crossover method.
A useful feature for short-term trading is the changing distance between the histogram and signal line.
Expanding bars can indicate increasing momentum, while shrinking bars can warn that the current movement is losing strength.
The tool becomes more effective when its signals are combined with price location.
A bullish MACD change at established support has a different significance from the same signal in the middle of a sideways range. The same principle applies to bearish signals near resistance.
Indicator Chart Setup
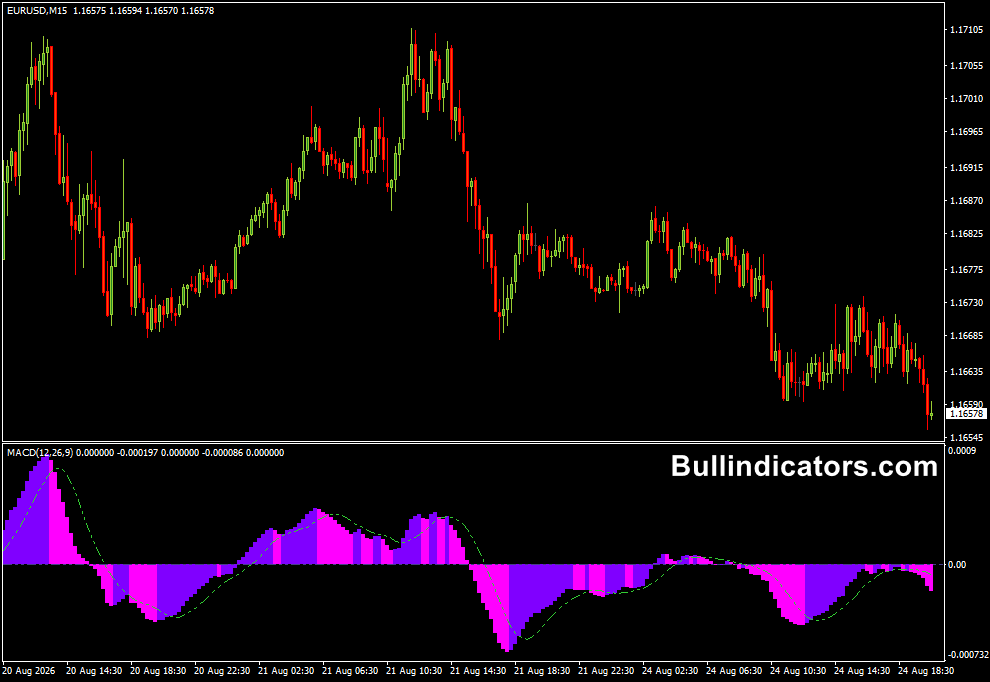
The MACD is displayed in a separate window below the price chart.
Blue histogram bars represent bullish momentum, while magenta bars indicate bearish momentum.
A lime-green signal line moves through the histogram, with the zero line providing the central reference point.
When the histogram expands above zero, bullish momentum is gaining strength.
Movement below zero indicates bearish pressure.
A shrinking histogram can provide an early warning that momentum is fading before the market actually changes direction.
Core Features
- Combines a MACD histogram and signal line.
- Uses different histogram colors for bullish and bearish momentum.
- Helps identify momentum expansion and contraction.
- Can be used with zero-line crossovers.
- Supports traditional MACD divergence analysis.
- Non-repainting calculation.
- Suitable for short-term and long-term analysis.
Best for
- Identifying changes in market momentum.
- Finding trend continuation setups.
- Spotting potential early reversals.
- Confirming breakouts from important price levels.
- Scalping on M1 and M5 charts.
- Divergence analysis on higher timeframes.
Best Markets
- EURUSD is a strong choice for fast MACD setups because of its liquidity and active intraday sessions.
- GBPUSD can produce stronger momentum bursts during London trading.
- USDJPY works well when directional moves develop around major session opens.
- EURJPY offers larger intraday swings that can produce pronounced MACD momentum changes.
- Gold (XAUUSD) can be used for momentum and breakout analysis, although its volatility requires wider risk parameters.
- Major stock indices can also be analyzed with the same momentum principles.
Trading Styles
- M1 and M5 scalping.
- Intraday momentum trading.
- Trend-following on M15 and H1.
- Swing trading on H4 and Daily charts.
- Breakout confirmation.
- MACD divergence strategies.
How traders use it
There are several ways to build a strategy around the 3 Color MACD. A classic approach is to monitor the zero line.
A move from below zero to above zero supports a bullish interpretation, while a move from above zero to below zero supports a bearish one.
For earlier entries, the histogram can be monitored before the zero-line crossover occurs.
For example, during a downtrend, bearish histogram bars may begin shrinking as price approaches support.
If the bars then change to bullish and momentum starts expanding, this can provide an early indication that sellers are losing control.
The opposite setup applies near resistance.
If bullish bars progressively become smaller and then change to bearish while price rejects resistance, the combination can provide an early warning of a downside move.
M1 Scalping Example
For an M1 EURUSD strategy, first identify a short-term support or resistance level.
Suppose EURUSD has been falling toward 1.1700 and begins rejecting the level. The MACD histogram is initially magenta, but the bars become progressively smaller. A blue histogram bar then appears and begins expanding.
Rather than entering immediately on the first color change, a scalper can wait for the next M1 candle to break the high of the signal candle.
If the recent swing low is 1.1695, a stop can be positioned below that area. A nearby intraday resistance level can provide the first profit target.
M5 Momentum Example
On an M5 chart, the 3 Color MACD can be used to capture larger directional movements.
Consider GBPUSD trading above 1.3400 after breaking through a previous resistance zone.
The histogram changes to blue and begins expanding above the zero line, while the signal line confirms improving bullish momentum.
A trader could wait for a controlled pullback rather than chasing the initial breakout.
If the histogram remains bullish during the retracement and then starts expanding again, the continuation setup becomes more attractive.
The previous breakout area can serve as a reference for risk, while the next higher resistance zone can be used as a potential target.
Get Instant Free Access
Indicator Settings
- FastEMA: Sets the fast EMA period used in the MACD calculation.
- SlowEMA: Sets the slow EMA period used for the MACD calculation.
- SignalSMA: Controls the period used to calculate the signal line.
- CountBars: Determines how many historical bars are included in the calculation.
- Line: Adjusts the width of the histogram bars.
- Zero_level: Allows an additional reference level to be added alongside the standard zero value.
Important Notes
- A histogram color change represents a change in momentum, not a guaranteed reversal.
- Zero-line crossovers are generally slower but can provide stronger trend confirmation.
- For M1 scalping, price spread and execution speed can have a significant effect on results.
- Signals around established support and resistance are generally more useful than signals appearing randomly inside a range.
- Divergence should be confirmed with price action because momentum can remain divergent for an extended period.
- MACD settings may need adjustment when moving between very fast and much slower timeframes.









