
The Breakout Pattern indicator for MT4 is designed to highlight potential breakout formations and directional moves directly on the price chart.
It uses colored triangle patterns together with confirmation arrows to identify bullish and bearish opportunities.
A blue triangle indicates a bullish pattern, while a red triangle points to a bearish formation.
The subsequent arrow provides additional confirmation of the expected direction.
This makes the setup particularly useful when price is leaving a consolidation area and beginning a stronger move.
The signals can be used across all MT4 timeframes, from fast M1 scalping to higher-timeframe swing trading.
For better selectivity, the breakout signals can also be filtered with a separate trend tool.
Download This MT4 Indicator for Free
Why traders use the Breakout Pattern Indicator
Breakouts are attractive because they can provide an entry near the beginning of an accelerated price movement.
The difficulty is separating genuine directional breaks from temporary moves that quickly return into the previous range.
This tool simplifies the process by marking potential breakout formations with triangles and then adding an arrow to confirm the direction.
Blue signals point toward bullish conditions, while red signals identify bearish conditions.
A particularly useful approach is to trade in the direction of the broader trend.
The Trend Line Indicator for MT4 can be used as a directional filter: a blue trend line represents a bullish trend and a red trend line represents a bearish trend.
Taking only breakout signals that agree with this direction can reduce counter-trend trades.
It may improve the quality of a strategy substantially, but an exact figure such as an 80% increase in winning trades cannot be guaranteed without testing the specific setup, market and timeframe.
Indicator Chart Setup
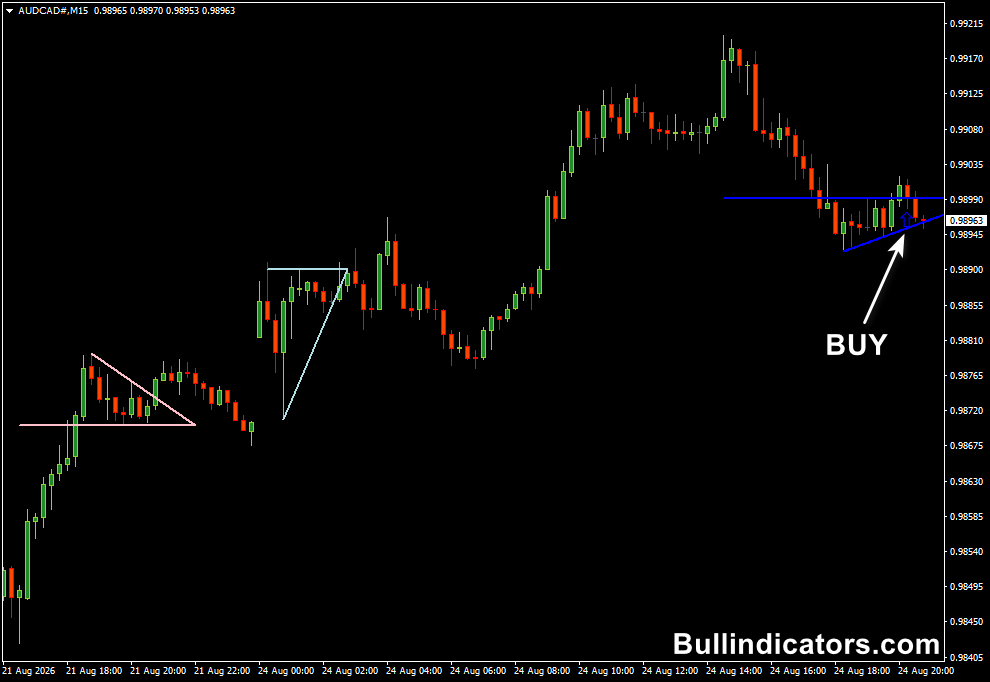
The chart displays open triangle formations around potential breakout areas.
Bullish patterns are shown in blue when active, while bearish patterns are displayed in red. Additional arrows mark the corresponding BUY and SELL signals.
An inactive bullish pattern uses PowderBlue by default and an inactive bearish pattern uses Pink.
Once the pattern becomes active, the colors change to blue or red.
This distinction helps separate developing formations from confirmed directional signals.
Core Features
- Identifies potential bullish and bearish breakout patterns.
- Uses blue and red triangle formations.
- Provides confirmation arrows following the pattern.
- Allows the minimum triangle height to be adjusted.
- Controls how many bars can pass before a pattern crosses.
- Works across different MT4 timeframes.
- Can be combined with trend-following tools for additional filtering.
Best for
- Identifying potential breakouts from consolidation.
- Finding early directional moves.
- Trading continuation setups.
- Filtering breakout signals with market direction.
- Short-term breakout scalping.
- Intraday and swing breakout strategies.
Best Markets
- EURUSD can provide clean breakout opportunities around London and New York session activity.
- GBPUSD is suitable when stronger momentum develops after periods of consolidation.
- USDJPY can offer useful setups around major session highs and lows.
- GBPJPY is interesting for aggressive breakout strategies because of its larger intraday ranges.
- XAUUSD can produce powerful breakouts, although its volatility calls for wider stops and careful position sizing.
Trading Styles
- M1 and M5 breakout scalping.
- M15 and H1 intraday trading.
- London-session breakout strategies.
- New York session momentum trading.
- Higher-timeframe breakout continuation setups.
- Trend-filtered price action trading.
How traders use it
The basic method is to identify the triangle first and then wait for the corresponding arrow.
A blue triangle followed by a blue arrow indicates a bullish setup, while a red triangle followed by a red arrow indicates a bearish setup.
For higher-quality setups, the direction can be filtered with the Trend Line Indicator.
When its line is blue, concentrate on bullish breakout signals. When it turns red, focus on bearish opportunities.
This removes many trades that attempt to fight the prevailing trend.
Buy Rules with Trend Line Indicator
- Trend Line should be blue, indicating a bullish market direction.
- Wait for a blue breakout triangle to form.
- Look for the blue confirmation arrow.
- For additional confirmation, wait for price to break the high of the signal candle.
- Place the stop-loss below a recent swing low or the breakout structure.
- Use the next resistance area or a predefined risk-to-reward ratio as the profit target.
Sell Rules with Trend Line Indicator
- Trend Line should be red, indicating a bearish market direction.
- Wait for a red breakout triangle.
- Confirm the setup with the red arrow.
- A break below the signal candle low can provide an additional entry trigger.
- Place the stop above the recent swing high.
- Use the next support area or a predefined risk-to-reward ratio for the target.
Example: EURUSD M5 Breakout
Imagine EURUSD has spent several candles trading between 1.1740 and 1.1750 on the M5 chart.
The Trend Line is blue, showing that the broader short-term direction remains bullish.
Price then pushes toward the upper boundary and a blue breakout triangle appears.
A trader can wait for the blue arrow and then monitor the 1.1750 resistance area.
If an M5 candle closes above the range and the following candle breaks its high, a BUY entry can be considered.
A recent swing low around 1.1743 could provide the stop reference, while 1.1760 or the next significant resistance area could be used as a potential target.
If the Trend Line were red during the same setup, the bullish triangle could be ignored.
This directional filter is particularly useful during volatile sessions, when breakout signals can appear on both sides of a range.
Get Instant Free Access
Indicator Settings
- Min. height of splash, pts: Sets the minimum height required for a triangle pattern. The default value is 200 points.
- Max. bars before crossing: Determines the maximum number of bars allowed before the pattern crosses. The default value is 20.
- Color of bull not active pattern: Sets the color for an inactive bullish pattern. The default is PowderBlue.
- Color of bear not active pattern: Sets the color for an inactive bearish pattern. The default is Pink.
- Color of bull active pattern: Controls the color of an active bullish pattern. The default is Blue.
- Color of bear active pattern: Controls the color of an active bearish pattern. The default is Red.
- Buy signal arrow color: Sets the color of the BUY confirmation arrow. The default is blue.
- Sell signal arrow color: Sets the color of the SELL confirmation arrow. The default is red.
Important Notes
- A triangle identifies a potential breakout pattern, while the arrow provides additional confirmation.
- Breakouts can fail, particularly when price remains inside a broader consolidation range.
- Following the main trend can help avoid taking signals against stronger market momentum.
- A blue Trend Line indicates bullish conditions and a red Trend Line indicates bearish conditions.
- Waiting for price to break the signal candle can reduce premature entries.
- The 80% improvement in winning trades should not be assumed as a fixed result; performance must be verified through backtesting and forward testing.
- Risk should be adjusted to the volatility of the market and timeframe being traded.









