
The Grid Round Numbers indicator for MT4 automatically marks psychological price levels across the chart.
These rounded prices are widely watched because orders, entries, exits and profit targets are often concentrated around easily recognized numbers such as 1.1000, 1.1050 or 150.00.
The tool creates a price grid at equal intervals, making these levels easy to monitor on any timeframe.
A round number can become a reaction area, particularly when it coincides with previous highs, lows, Fibonacci levels or strong price action.
This makes the Grid Round Numbers Indicator useful for planning trades as well as managing existing positions.
Download This MT4 Indicator for Free
Why traders use the Grid Round Numbers Indicator
Psychological price levels are among the simplest reference points in technical analysis, but they can be difficult to track consistently when a chart is moving quickly.
The Grid Round Numbers Indicator solves this by displaying the levels directly on the price chart.
The lines can be used to identify areas where price may hesitate, reject a level or accelerate through it.
A round number becomes more significant when it has already acted as support or resistance.
Multiple reactions around the same price can turn a psychological level into an important trading zone.
The grid is also useful for trade management.
A nearby round number can provide a logical location for a stop-loss or partial profit, while the next level can serve as a potential final target.
The spacing can be adjusted according to the instrument and the trading timeframe.
Indicator Chart Setup
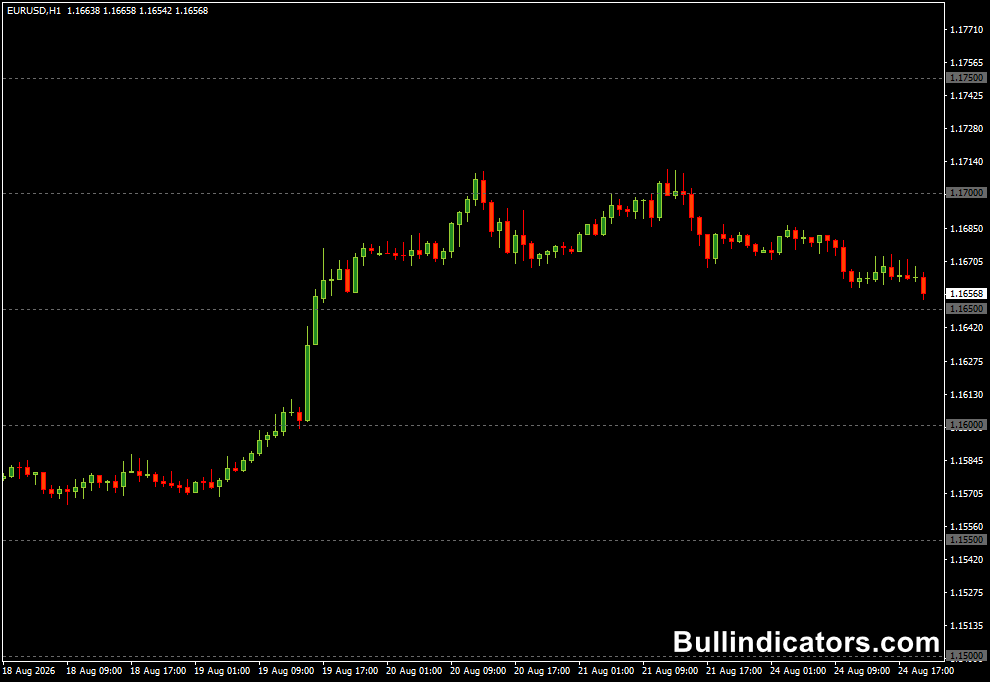
Once applied to an MT4 chart, the Grid Round Numbers Indicator draws horizontal lines at regular rounded price intervals.
For example, on EURJPY with a 50-pip grid, the chart may show levels such as 163.500, 164.000, 164.500 and 165.000.
On currency pairs with five-digit pricing, the displayed levels correspond to the selected pip distance.
The same principle applies to other markets, although the most practical grid spacing can vary considerably between Forex pairs, gold and indices.
Core Features
- Automatically plots psychological round-number levels.
- Maintains equal spacing between the displayed prices.
- Helps identify potential support and resistance areas.
- Can be used for entries, exits and trade management.
- Works across different MT4 timeframes.
- Allows the grid distance to be customized.
- Provides adjustable line color and style.
Best for
- Finding psychological support and resistance.
- Planning breakout and rejection trades.
- Locating potential profit-taking areas.
- Setting stop-loss levels around important prices.
- Combining round numbers with Fibonacci retracements.
- Refining lower-timeframe entries around major price levels.
Best Markets
- EURUSD and GBPUSD are excellent choices because major psychological levels are frequently monitored during the London and New York sessions.
- USDJPY and EURJPY work particularly well with round-number analysis because prices are naturally quoted around levels such as 150.00, 160.00 and 165.00.
- GBPJPY can produce strong reactions around major 00 and 50 levels during volatile sessions.
- XAUUSD can also benefit from psychological price analysis, although the grid spacing should be adapted to gold’s larger average movements.
- Major stock indices can be analyzed with the same concept by selecting a suitable price interval for the instrument.
Trading Styles
- Scalping around nearby psychological levels.
- Intraday breakout and rejection trading.
- Swing trading using major round numbers as reference zones.
- Position trading with higher-timeframe psychological levels.
- Price-action trading combined with Fibonacci or market structure.
How traders use it
The most effective approach is to treat the lines as areas of interest rather than automatic buy or sell signals.
Price behavior around a round number determines whether the level is acting as support, resistance or a breakout point.
For a BUY setup, traders can look for price to approach a round-number support level and then show bullish rejection.
A bullish candlestick pattern, a higher low or a break above the rejection candle can provide additional confirmation.
The stop-loss can be placed below the nearby swing low, while the next round number provides a potential target.
For a SELL setup, the process is reversed.
Price approaching a psychological resistance level can be monitored for bearish rejection.
A break below the low of the confirmation candle can provide the entry trigger, with the stop above the recent swing high and the next lower round number acting as a possible profit target.
Example: EURUSD M5 Round Number Strategy
Consider EURUSD trading around 1.1050 on the M5 chart.
The Grid Round Numbers Indicator displays 1.1050 as a psychological level, while the next levels are 1.1000 and 1.1100.
Suppose EURUSD repeatedly tests 1.1050 and fails to break below it. A bullish M5 candle then closes back above the level.
A scalper could wait for the high of that candle to break before entering a BUY position.
If the recent swing low is at 1.1042, the stop-loss could be placed below that area.
The next psychological level at 1.1100 becomes a potential target, while the trade can also be managed by taking partial profit if price begins to stall before reaching the target.
The same concept applies to a bearish setup.
If EURUSD approaches 1.1100 several times and repeatedly rejects the level, a bearish reversal candle can provide the initial signal.
A break below its low may trigger a SELL trade, with the stop above the recent swing high and 1.1050 serving as a potential target.
Get Instant Free Access
Indicator Settings
- Grid space: Determines the distance in pips between each psychological price level.
- Line color: Sets the color of the grid lines displayed on the chart.
- Line style: Controls the appearance and style of the plotted lines.
Important Notes
- Round numbers are reference levels, not guaranteed reversal points.
- The significance of a level increases when it aligns with previous highs, lows, Fibonacci levels or strong price action.
- Grid spacing should be adapted to the instrument and timeframe rather than using one setting everywhere.
- Very small spacing can create too many levels on volatile markets and reduce the usefulness of the grid.
- Breakouts should be assessed using candle closes and current market momentum rather than assuming every level will hold.
- The tool can be used on its own for price-level analysis, but combining it with price action and other technical methods can improve trade selection.









