
The Color RSI Indicator for MT5 is an enhanced version of the classic Relative Strength Index (RSI).
While the traditional RSI measures momentum, this version makes interpretation much easier by using color-coded zones and displaying BUY and SELL signals directly on the chart.
The result is a cleaner and faster way to identify potential reversal opportunities.
The oscillator changes color as momentum shifts between oversold, neutral, and overbought conditions.
This allows you to quickly recognize when buying or selling pressure is reaching an extreme.
Since the indicator works on every timeframe, it can be used for scalping, day trading, swing trading, and longer-term market analysis.
Although the signals are straightforward, the best results are achieved when they are confirmed by the overall market trend rather than traded in isolation.
Why traders use the Color RSI Indicator
Momentum oscillators remain among the most popular technical analysis tools because they help identify potential turning points before price fully changes direction.
The Color RSI Indicator simplifies this process by replacing the standard RSI display with an easy-to-read color system while also providing visual trading signals.
Many traders use the indicator to spot pullbacks within an existing trend instead of trying to predict every reversal.
By combining momentum with trend confirmation, false signals can often be reduced and higher-probability opportunities become easier to identify.
Download This MT5 Indicator for Free
Indicator Chart Setup
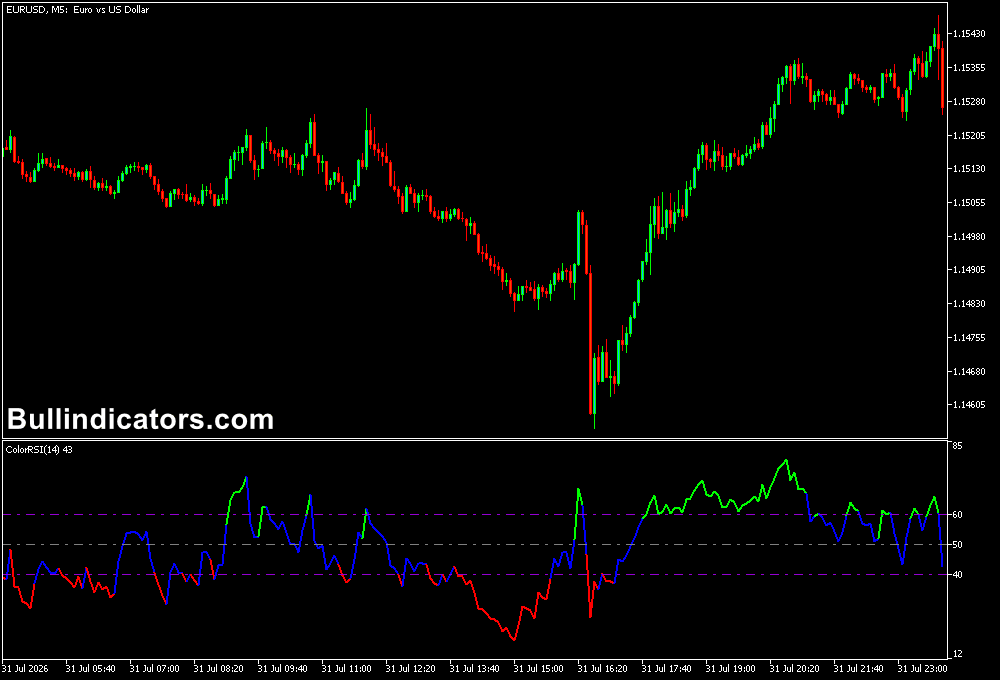
The indicator appears in a separate oscillator window beneath the price chart.
The RSI changes color according to current momentum conditions.
Red highlights oversold conditions, green identifies overbought conditions, while blue represents neutral momentum between both zones.
BUY and SELL signals are generated whenever the oscillator detects potential reversal opportunities.
Core Features
- Color-coded RSI for faster market analysis.
- Built-in BUY and SELL signals.
- Highlights overbought and oversold conditions.
- Works on every MT5 timeframe.
- Suitable for Forex, commodities, indices, and cryptocurrencies.
- Easy to combine with trend-following strategies.
Best for
- Momentum trading.
- Finding pullbacks within trends.
- Reversal confirmation.
- Entry timing.
- Multi-timeframe analysis.
Best Markets
- EUR/USD – Excellent for identifying momentum reversals during established trends on M15 and H1 charts.
- GBP/USD – Strong London session volatility creates frequent RSI pullback opportunities.
- USD/JPY – Performs well during trending markets where momentum shifts are clearly visible.
- XAU/USD (Gold) – Useful for spotting momentum exhaustion before continuation or reversals.
- NAS100 – Effective for buying pullbacks during strong bullish trends and identifying weakening momentum.
- Major Forex pairs – High liquidity generally produces cleaner momentum signals than lower-volume markets.
Trading Styles
- Scalping on M5 and M15 charts.
- Intraday trading on M30 and H1.
- Swing trading on H4 and Daily charts.
- Trend-following strategies using multiple timeframes.
- Momentum trading across major Forex pairs and Gold.
How traders use it
A reliable approach is to combine the Color RSI Indicator with the Trigger Line Indicator for MT5.
The Trigger Line defines the primary trend, while the Color RSI provides the entry timing.
Buy Rules:
- The Trigger Line must be blue, confirming an uptrend.
- Wait for the RSI to fall into the oversold zone and generate a BUY signal.
- Enter after the current candle closes or after bullish price confirmation.
- Place the stop loss below the most recent swing low.
- Take profit at the next major resistance level, when the risk-to-reward ratio reaches at least 1:2, or when an opposite SELL signal appears.
Sell Rules:
- The Trigger Line must be red, confirming a downtrend.
- Wait for the RSI to move into the overbought zone and generate a SELL signal.
- Enter after bearish confirmation.
- Place the stop loss above the previous swing high.
- Take profit near the next support level, when the reward reaches at least twice the initial risk, or when a BUY signal appears.
For example, imagine EUR/USD is trading above a blue Trigger Line on the H1 timeframe.
A temporary pullback pushes the RSI into the red oversold zone before a BUY signal appears.
Once the next bullish candle closes, a long position can be opened with the stop below the recent swing low.
As the main trend resumes, the trade remains open until resistance is reached or the RSI produces an opposite signal.
Get Instant Free Access
Indicator Settings
- OverBought Level – Sets the RSI value where overbought conditions begin.
- OverSold Level – Defines the RSI value used to identify oversold conditions.
- Medium of the Range – Adjusts the RSI midline used for momentum evaluation.
- Levels Color – Changes the appearance of the RSI level lines.
Important Notes
- Signals are generally more reliable when traded in the direction of the prevailing trend.
- Avoid opening positions solely because the RSI reaches an extreme level.
- Use higher timeframes to determine the dominant market direction.
- Confirm entries with price action or candlestick patterns whenever possible.
- Always apply proper risk management and predefined stop-loss levels.
- The indicator performs well across Forex, Gold, indices, and other liquid markets.









