
The Trigger Line indicator for MT5 is a trend-based technical tool designed to identify potential entry and exit points by analyzing price momentum and trend direction.
It combines the R-period calculation with the Least Squares Moving Average (LSMA) to detect changes in market behavior and highlight possible trading opportunities.
The indicator displays a dynamic trigger line that changes color when momentum shifts.
These color changes, together with line crossovers, help identify bullish and bearish conditions.
It can be used for trend continuation strategies as well as short-term reversal setups across forex, indices, commodities, stocks, and cryptocurrencies.
Why Traders Use the Trigger Line Indicator
Timing an entry during a trend can be difficult because markets frequently experience temporary pullbacks and false movements.
The Trigger Line Indicator simplifies this process by showing when momentum begins shifting in favor of buyers or sellers.
The combination of LSMA and the R-period calculation allows the indicator to react quickly to price changes while maintaining a smooth visual trend representation.
This makes it useful for traders who want earlier signals without relying only on traditional moving averages.
This tool works particularly well when combined with price action.
For example, after a bullish trigger line crossover, traders can wait for a bullish engulfing candle or another confirmation pattern before entering a long position.
This additional confirmation can help avoid weaker signals and improve trade selection.
Download This MT5 Indicator for Free
Indicator Chart Setup
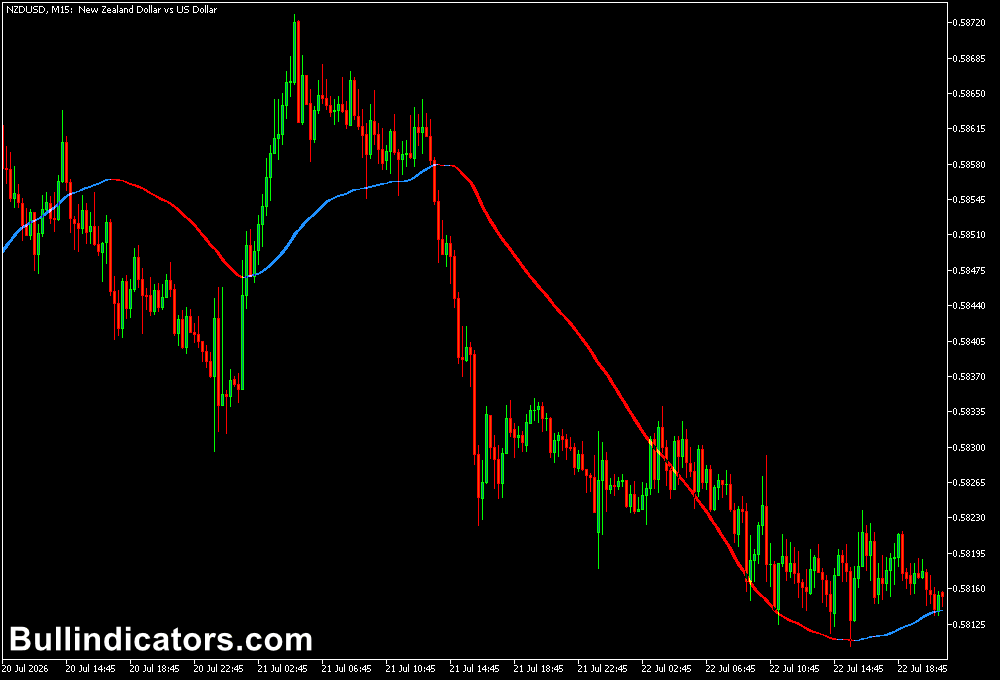
After attaching the indicator to a MetaTrader 5 chart, a trigger line appears in the main chart window.
The line changes color depending on the current market condition, providing a visual indication of bullish or bearish momentum.
Buy and sell signals are generated when the trigger line crosses and changes color.
Bullish signals are represented by a transition toward blue and pink colors, while bearish signals appear with yellow and red color changes.
These visual signals help traders quickly recognize possible trend shifts.
Core Features
- Uses R-period and LSMA calculations.
- Displays dynamic trend direction.
- Provides crossover-based entry and exit signals.
- Changes color according to market momentum.
- Suitable for scalping and intraday trading.
- Works on all MetaTrader 5 timeframes.
Best for
- Trend-following strategies.
- Momentum trading.
- Short-term reversal detection.
- Entry and exit timing.
- Price action confirmation.
- Multi-timeframe analysis.
Best Markets
- EUR/USD, GBP/USD, USD/CAD, and CAD/CHF.
- Gold (XAU/USD).
- NASDAQ 100 and S&P 500.
- Bitcoin and other cryptocurrencies.
- Major commodity markets.
- Liquid stock CFDs.
Trading Styles
- Scalping on M1 and M5 charts.
- Intraday trading on M15 and M30.
- Trend trading on H1 and H4.
- Swing trading using Daily charts.
- Breakout continuation strategies.
- Price action-based entries.
How Traders Use It
A bullish setup occurs when the trigger line crosses and changes into bullish colors.
Many currency traders wait for additional confirmation, such as a bullish candle pattern, before entering a buy position.
For example, a blue and pink trigger signal followed by a bullish engulfing candle can provide a stronger long entry opportunity.
A bearish setup follows the opposite conditions.
When the trigger line crosses and changes toward yellow and red, traders look for bearish confirmation before opening a short position.
A bearish engulfing pattern or rejection candle near resistance can strengthen the setup.
The indicator is most effective when the market is trending.
During sideways conditions, crossover signals may occur more frequently, so combining the Trigger Line with support and resistance analysis, volume tools, or another trend filter can help improve results.
Get Instant Free Access
Indicator Settings
- Period: Defines the value of the R-period calculation.
- LSMA_Period: Sets the calculation period for the Least Squares Moving Average.
- Price Type: Selects the price source used for indicator calculations.
- Shift: Adjusts the position of the indicator line on the chart.
- Push: Controls the indicator display adjustment.
Important Notes
- The Trigger Line Indicator works best when combined with additional technical confirmation.
- Trend-following signals are generally stronger during active market conditions.
- Use candle patterns to confirm crossover signals before entering trades.
- Higher timeframes usually provide more reliable signals.
- Lower timeframes can be useful for scalping but may generate more false signals.
- Always apply proper risk management when trading indicator-based signals.









