
The Breakout Zones indicator for MetaTrader 5 is designed for traders who specialize in support and resistance breakouts.
It automatically identifies important price zones and plots horizontal breakout levels directly on the chart, making it easier to recognize when the market is preparing for a directional move.
Instead of manually drawing key levels every trading session, the indicator continuously calculates and displays them based on recent price activity.
Breakout trading remains one of the most popular trading approaches because strong price movements often begin after support or resistance has been broken.
The indicator helps traders monitor these critical areas while allowing them to focus on confirming whether a breakout has enough momentum to continue.
Why Traders Use the Breakout Zones Indicator
Support and resistance levels often determine where buyers and sellers become active.
When price finally escapes one of these zones, momentum frequently increases as new market participants enter the trade.
The Breakout Zones Indicator highlights these areas automatically, giving traders a clear framework for planning entries and managing risk.
Many traders also appreciate that the indicator works across multiple timeframes, making it suitable for intraday trading, swing trading, and even longer-term market analysis.
Combined with price action or volume confirmation, breakout zones can become valuable decision points.
Download This MT5 Indicator for Free
Indicator Chart Setup
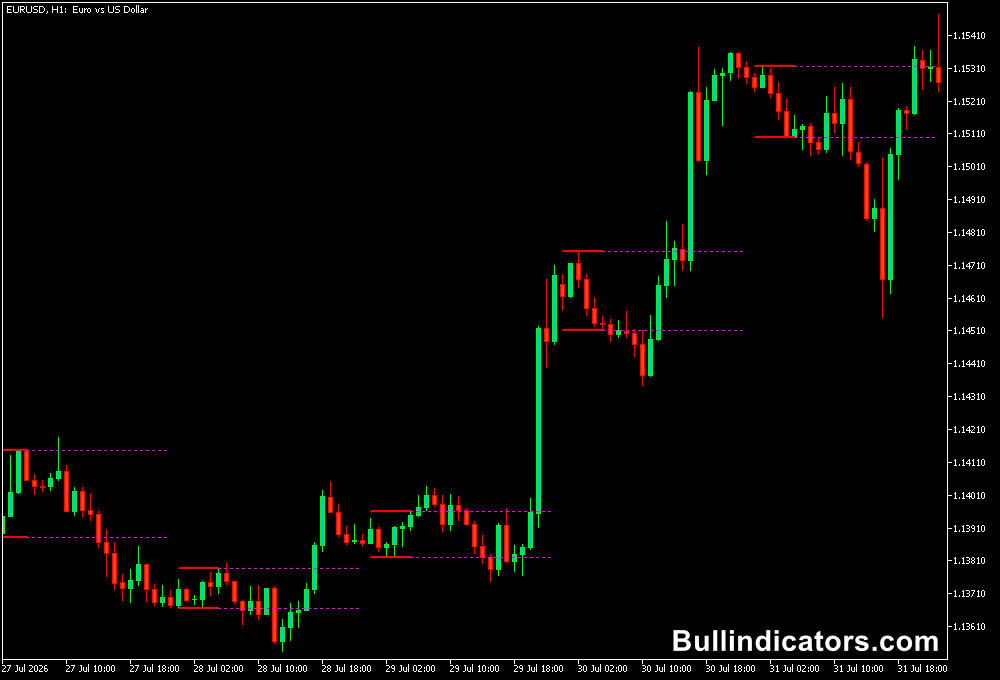
The indicator draws clearly defined horizontal support and resistance levels that represent the current breakout zone.
As price approaches these boundaries, traders can prepare for a possible bullish or bearish breakout.
A candle closing beyond one of the lines often provides stronger confirmation than entering while the breakout candle is still forming.
The plotted levels update according to the selected calculation period, allowing traders to adapt the indicator to different trading sessions or market conditions.
Core Features
- Automatically plots breakout support and resistance zones.
- Suitable for all MT5 financial instruments.
- Helps identify bullish and bearish breakout opportunities.
- Simple visual layout for quick market analysis.
- Customizable calculation period and line appearance.
- Works well alongside price action and volume analysis.
Best for
- Support and resistance breakout trading.
- Session breakout strategies.
- Momentum-based entries.
- Planning trades around key technical levels.
- Identifying high-volatility market moves.
Best Markets
- EURUSD during the London session when liquidity increases.
- GBPJPY for strong breakout momentum following consolidations.
- EURJPY where directional moves often extend after resistance breaks.
- GBPUSD during major economic news releases.
- US30 and NAS100 during the New York market open.
- XAUUSD (Gold) when volatility expands after range-bound trading.
Trading Styles
- London session breakout trading on M15 and M30.
- Intraday momentum trading on H1 charts.
- Swing trading using H4 breakout confirmations.
- News trading after confirmed support or resistance breaks.
- Trend continuation strategies following consolidation phases.
How Traders Use It
A common strategy is waiting for price to close above the resistance level before opening a buy position.
Likewise, a candle closing below support may indicate that bearish momentum is developing.
Waiting for the candle to finish helps reduce the number of false breakouts that occur during volatile price spikes.
Traders place their stop loss beyond the opposite side of the breakout zone or beyond the most recent swing high or swing low.
Since the indicator focuses on identifying breakout levels rather than exit targets, take profit levels are often determined using nearby resistance, support, or a predefined risk-to-reward ratio such as 1:2 or higher.
Example: Trading Breakouts with the MACD 4C Indicator
One effective breakout strategy is combining the Breakout Zones Indicator with the MACD 4C Indicator for MT5.
The breakout levels identify where price may begin a new trend, while the MACD 4C histogram helps confirm whether bullish or bearish momentum is supporting the move.
Trading only in the direction of the prevailing momentum can filter out many weak breakout signals.
BUY Trade Rules
- Wait for the price to close above the breakout resistance zone.
- Confirm that the MACD 4C histogram is green, indicating bullish momentum.
- Enter a BUY position after the breakout candle closes or on a small pullback toward the breakout level.
- Place the stop loss below the breakout zone or below the most recent swing low.
- Take profit at the next major resistance level or use a minimum 1:2 risk-to-reward ratio.
SELL Trade Rules
For SELL trades, apply the same logic in reverse.
Wait for a confirmed break below support and ensure the MACD 4C histogram is red before entering a short position.
Trading breakouts in the direction of momentum helps avoid many false signals that often occur during sideways markets.
Get Instant Free Access
Indicator Settings
- Period Hour Begin: Starting hour used for calculating the breakout zone.
- Period Minutes Begin: Starting minute for the calculation period.
- Period Hour End: Ending hour for calculating the support and resistance levels.
- Period Minutes End: Ending minute for the selected calculation window.
- Colors: Customize the appearance of the breakout lines.
- Line Style: Select the preferred line style displayed on the chart.
Important Notes
- Always wait for breakout confirmation before entering a position.
- False breakouts can occur, especially during low-volume market conditions.
- Volume indicators or momentum oscillators can provide additional confirmation.
- The indicator works particularly well during active London and New York trading sessions.
- Adjust the calculation period to match your preferred trading session.
- Apply sound risk management, as not every breakout develops into a sustained trend.









