
The Advanced ADX indicator for MT5 is designed to show both the direction and strength of a market trend through a simple color-based histogram.
The Average Directional Movement Index provides a visual alternative to the standard ADX display, making changes in market momentum easier to recognize.
The histogram alternates between green and red based on the detected directional movement and also marks potential buy and sell points.
It can be used independently for basic signal generation or combined with price action, moving averages, support and resistance, or other technical tools for additional confirmation.
Why traders use the Advanced ADX Indicator
ADX is commonly used to determine whether a market is trending and how strong that movement is.
The Advanced ADX presents this information through a histogram rather than the traditional D+ and D- lines, giving the chart a straightforward visual signal.
The color changes can help identify shifts in directional pressure while the histogram remains useful for monitoring an existing position.
A sequence of green bars can support a bullish bias, while red bars can indicate bearish conditions.
This makes the tool useful for both trend-following setups and shorter-term momentum trading.
Download This MT5 Indicator for Free
Indicator Chart Setup
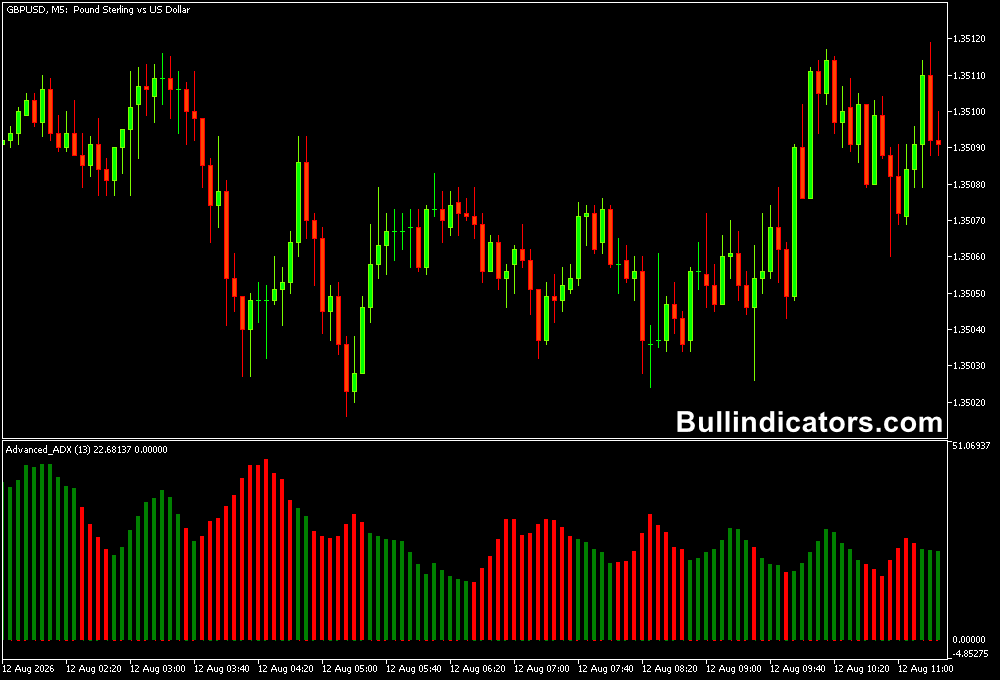
The Advanced ADX appears in a separate indicator window beneath the price chart.
Its histogram uses green and red bars to display the prevailing directional movement.
A color transition can draw attention to a potential change in market direction, while continued bars of the same color can help track an established move.
The display works across different timeframes, allowing the same tool to be used for quick intraday analysis as well as higher-timeframe trend assessment.
Core Features
- ADX-based trend direction and strength analysis.
- Green and red histogram display.
- Visual buy and sell signal changes.
- Simple alternative to the standard ADX D+ and D- presentation.
- Suitable for standalone analysis or indicator confluence.
- Works across multiple MT5 timeframes and currency pairs.
Best for
- Identifying changes in directional momentum.
- Following established bullish and bearish movements.
- Confirming trend direction before entering a position.
- Monitoring momentum during open trades.
- Filtering short-term setups by checking the broader trend.
Best Markets
- EURUSD and GBPUSD during the London and US sessions, particularly when spreads are low.
- USDJPY for intraday directional movements and momentum setups.
- EURJPY and GBPJPY when stronger price swings provide sufficient movement between signals.
- Major forex pairs with consistently tight spreads for short-term trading.
Trading Styles
- M5 and M15 scalping during the London and US sessions.
- M15 and H1 intraday trend trading on liquid major pairs.
- H1 and H4 trend-following setups when looking for longer directional moves.
- Multi-timeframe analysis using H4 or H1 for direction and M5 for entry timing.
How traders use it
A basic approach is to monitor the histogram for a color change and then check the price action around the signal.
A transition to green can be used as a bullish signal, while a transition to red can indicate a potential bearish setup.
Position management can continue while the histogram maintains the same directional color, with an opposite signal providing a reason to reassess the trade.
Buy Example
- EURUSD is trading during the London session on the M5 chart with a low spread.
- The Advanced ADX histogram changes from red to green.
- Price breaks above a nearby short-term resistance level, providing additional confirmation.
- A buy entry can be considered after the bullish confirmation.
- The recent swing low can provide a reference for stop loss placement, while a previous high or suitable resistance area can be used for the target.
Sell Example
- GBPUSD is moving lower during the US session on the M5 chart.
- The histogram changes from green to red.
- Price remains below nearby resistance and confirms the bearish direction.
- A sell entry can be considered after the confirmation.
- A recent swing high can provide a stop loss reference, with previous support serving as a potential target.
Get Instant Free Access
Indicator Settings
- ADXPeriod: Sets the calculation period used by the ADX. A lower value can make the calculation more responsive, while a higher value can produce a smoother reading.
- Colors: Controls the colors used for the histogram display.
Important Notes
- For scalping, focus on liquid pairs with low spreads during the London and US sessions.
- A histogram color change should be evaluated together with the current price structure and market conditions.
- Higher timeframes can provide useful directional context before taking an M5 or M15 setup.
- The indicator does not guarantee profitable entries; proper stop loss and position sizing remain important.
- Very low-volatility or sideways markets can produce less useful directional signals.









