
The Breakout indicator for MT5 is designed to identify important support and resistance zones where price is likely to break into a new directional move.
It automatically plots breakout areas on the chart, allowing traders to monitor key price levels without manually drawing support and resistance.
The indicator is especially effective on the H1 timeframe, where it helps traders spot breakout opportunities with greater confidence and prepare for potential trend continuation.
Why traders use the Breakout Indicator
Breakout strategies remain popular because strong price moves often begin after support or resistance levels are broken.
The challenge is identifying the most significant zones before the breakout occurs.
This indicator simplifies the process by automatically highlighting important trading ranges that deserve attention.
Many traders use the indicator to monitor price as it approaches these levels, waiting for confirmation before entering the market.
It is suitable for both beginners and experienced traders, as it removes much of the manual work involved in identifying breakout areas while keeping the chart clean and easy to interpret.
Download This MT5 Indicator for Free
Indicator Chart Setup
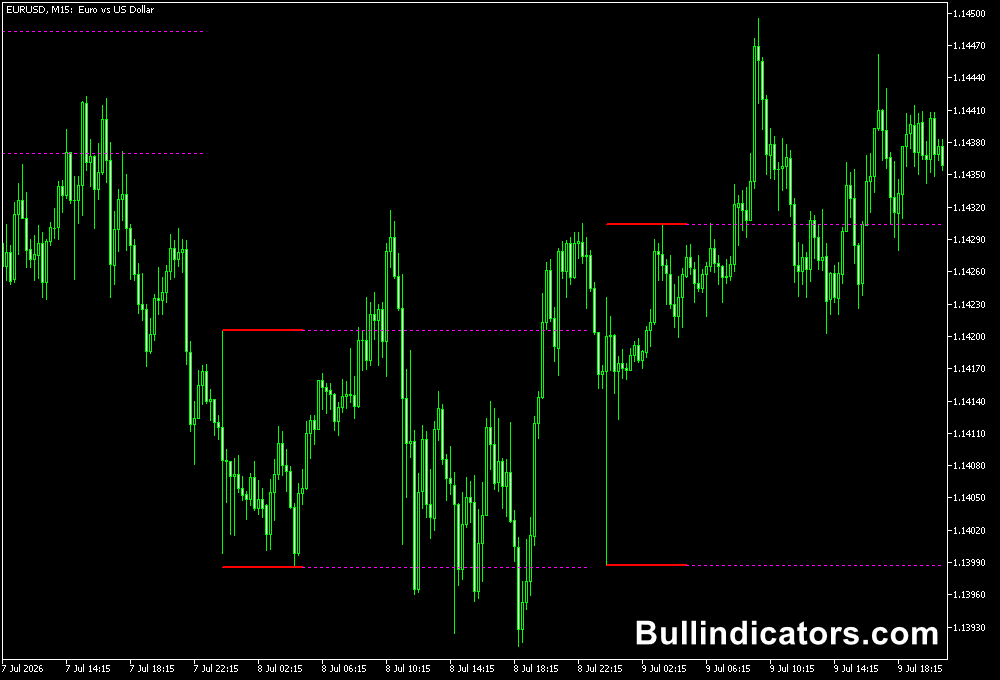
After attaching the indicator, support and resistance zones are automatically drawn on the chart to highlight potential breakout areas.
As price approaches these zones, traders can monitor whether momentum is building for a breakout or whether the market rejects the level.
The indicator is optimized for H1 charts and is intended for timeframes below H4, where the breakout zones remain accurate and easy to follow.
Core Features
- Automatically detects breakout zones.
- Draws important support and resistance areas.
- Optimized for the H1 timeframe.
- Reduces the need for manual technical analysis.
- Suitable for trend continuation strategies.
- Simple visual display for quick decision-making.
Best for
- Breakout trading.
- Support and resistance analysis.
- Trend continuation entries.
- Retest confirmation setups.
- Intraday market analysis.
Best Markets
- Currency pairs that regularly form consolidation ranges before strong directional moves.
- Gold during active trading sessions with increased volatility.
- Major stock indices that frequently produce opening-range breakouts.
- Fast-moving CFD markets where momentum develops after key levels break.
- Liquid markets with consistent trading volume and narrow spreads.
Trading Styles
- Scalping.
- Day trading.
- Intraday trading.
- Breakout trading.
- Momentum trading.
How traders use it
One common approach is to wait for a candle to close completely outside the highlighted breakout zone before considering a trade in the direction of the move.
Many traders improve the quality of their entries by waiting for price to return and retest the broken level.
A rejection candle with a long wick after the retest often provides additional confirmation that the breakout is likely to continue.
This technique can help filter weaker breakouts while offering more precise entry points.
Get Instant Free Access
Indicator Settings
- Hour Begin – Sets the starting hour used to calculate the breakout zone.
- Minutes Begin – Defines the starting minute of the calculation period.
- Hour End – Sets the ending hour used for the breakout calculation.
- Minutes End – Defines the ending minute of the calculation.
- Area Hour End – Determines how long the breakout area remains displayed in hours.
- Area Minutes End – Specifies the ending minute for displaying the breakout area.
Important Notes
- The indicator is designed for timeframes below H4 and delivers the best performance on H1 charts.
- Waiting for a candle to close beyond the breakout zone can reduce false signals.
- Retests of broken support or resistance often provide higher-probability trade entries.
- Strong market momentum and increased trading volume can improve breakout reliability.
- Always use appropriate stop-loss placement, as not every breakout develops into a sustained trend.









