
The MACD Divergence indicator for MT5 is a powerful technical analysis tool designed to automatically detect bullish and bearish divergences between price action and the MACD indicator.
Divergence is one of the most popular methods for identifying possible trend reversals because it reveals when momentum begins changing before price follows.
The indicator scans the chart automatically and highlights divergence patterns with colored lines and trading arrows.
It detects both regular divergence and reverse divergence, providing traders with valuable information about possible market turning points.
This tool works on all MetaTrader 5 timeframes and can be applied to forex, stocks, indices, commodities, and cryptocurrencies.
Why Traders Use the MACD Divergence Indicator
Finding divergence manually can be challenging because it requires comparing price highs and lows with MACD momentum movements.
The MACD Divergence Indicator simplifies this process by identifying these patterns automatically and displaying them directly on the chart.
Regular divergence can signal that an existing trend is losing momentum and a reversal may be approaching.
Reverse divergence can highlight continuation opportunities when price and momentum move differently during an established trend.
The indicator is especially useful for scalping and short-term trading when combined with a trend confirmation tool.
For example, combining MACD divergence signals with a trend indicator can help filter weak setups and focus only on trades that align with the market direction.
This type of confirmation can significantly improve trade quality and may increase the number of successful setups compared with using divergence signals alone.
Download This MT5 Indicator for Free
Indicator Chart Setup
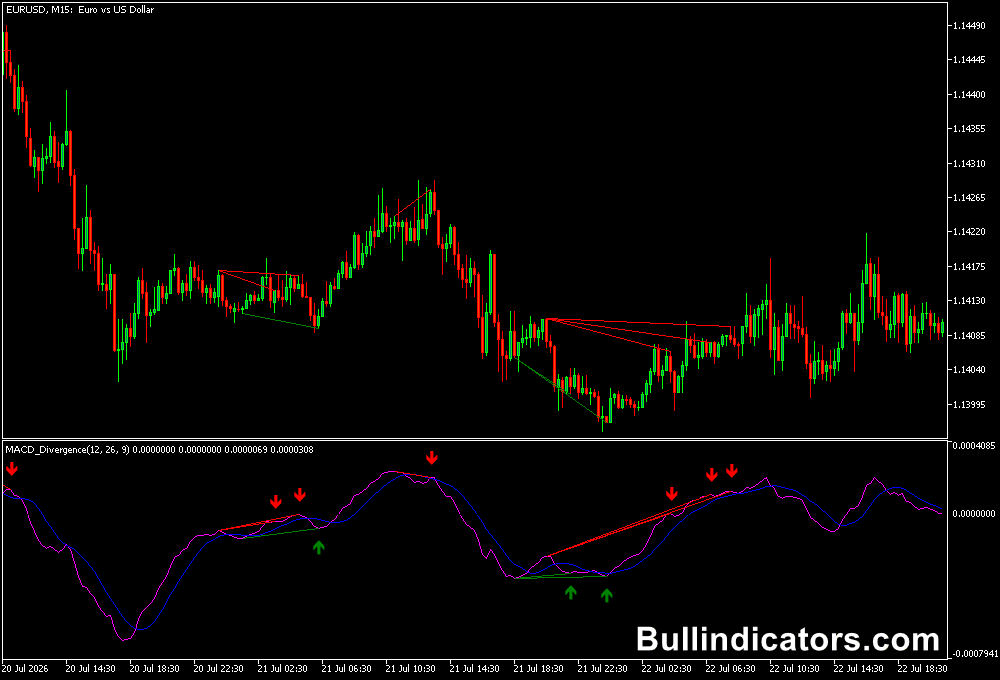
After installing the indicator on MetaTrader 5, divergence signals appear directly on the price chart.
Bullish divergences are displayed with green lines, while bearish divergences appear in red.
The indicator also plots buy and sell arrows to highlight potential entry areas.
The MACD calculation lines are displayed separately using different colors, allowing traders to visually compare momentum changes with price movement.
Regular divergences are shown with solid lines, while reverse divergences are displayed using dotted lines.
Core Features
- Automatically detects bullish and bearish divergence patterns.
- Displays regular and reverse divergence signals.
- Provides buy and sell arrow alerts.
- Plots divergence lines directly on the chart.
- Includes customizable MACD parameters.
- Works on every MetaTrader 5 timeframe.
Best for
- Trend reversal trading.
- Momentum analysis.
- Scalping strategies.
- Intraday setups.
- Higher timeframe confirmation.
- Price and indicator comparison.
Best Markets
- EUR/USD, GBP/USD, USD/JPY, and EUR/JPY.
- Gold (XAU/USD).
- NASDAQ 100 and S&P 500.
- Bitcoin and Ethereum.
- Major stock CFDs.
- Commodity markets.
Trading Styles
- Scalping on M1 and M5 with trend confirmation.
- Intraday trading on M15 and M30.
- Swing trading on H1 and H4.
- Daily chart reversal analysis.
- Momentum-based trading strategies.
- Multi-timeframe divergence analysis.
How Traders Use It
A bullish divergence occurs when price creates a lower low while the MACD indicator forms a higher low.
This suggests that selling pressure is weakening and a possible upward reversal may develop.
Traders often wait for additional confirmation, such as a bullish candle pattern or a trend indicator turning positive before entering a buy position.
A bearish divergence appears when price creates a higher high while MACD forms a lower high.
This can indicate weakening buying momentum and a possible downward move.
Short positions can be considered when additional technical confirmation supports the signal.
For scalping, traders can combine the MACD Divergence Indicator with a trend indicator.
For example, only taking buy divergence signals when price is above a moving average or another trend filter can remove many low-quality setups.
This approach allows traders to follow the dominant trend while using divergence for better entry timing.
Get Instant Free Access
Indicator Settings
- fastEma: Defines the Fast EMA period used for the MACD calculation.
- slowEma: Defines the Slow EMA period used for the MACD calculation.
- signalSMA: Sets the Signal SMA period for the MACD indicator.
Important Notes
- Divergence signals are stronger when combined with trend confirmation.
- The indicator delays signals by one candle to reduce repainting issues.
- Higher timeframes often provide stronger divergence setups.
- Use support and resistance levels to improve entry accuracy.
- Scalpers should combine divergence with a trend filter before entering trades.
- Always apply proper risk management when trading reversal signals.









