
The Perfect Trend Line indicator for MT5 is a trend-following tool that helps identify market direction using two dynamic trend lines and color-coded signals.
The indicator combines a fast and slow trend line to detect changes in momentum and displays visual buy and sell signals directly on the chart.
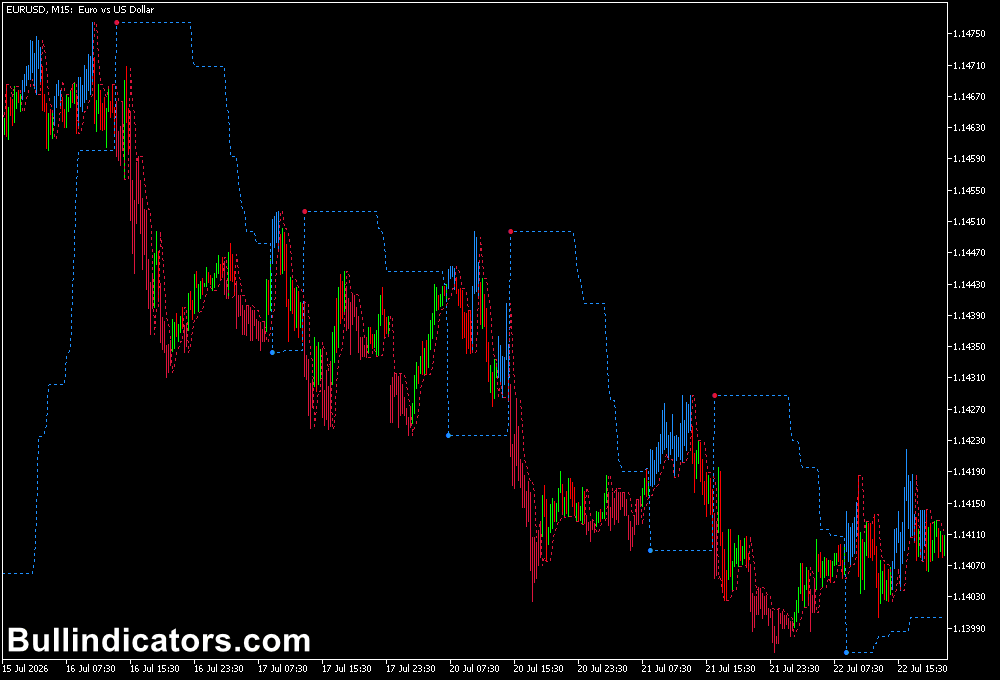
Along with trend lines, the indicator plots colored dots and can change candle colors according to market conditions.
Blue signals represent bullish momentum, while red signals indicate bearish pressure.
This makes it easier to recognize developing trends and potential entry or exit points without manually analyzing multiple indicators.
The indicator is suitable for forex, indices, commodities, stocks, and cryptocurrencies.
It performs especially well on higher timeframes where larger market trends are easier to identify.
Why Traders Use the Perfect Trend Line Indicator
Following the trend is one of the most widely used trading approaches because strong market movements often continue in the same direction for extended periods.
The Perfect Trend Line Indicator simplifies trend identification by showing when momentum shifts from bullish to bearish or vice versa.
The combination of two trend lines provides additional confirmation compared with using a single moving average.
When the faster trend line crosses above the slower line together with a blue dot signal, it suggests increasing buying pressure.
A red dot combined with a bearish crossover indicates growing selling momentum.
For better accuracy, the indicator can be combined with a higher timeframe trend filter.
For example, traders can identify the overall direction on the H4 or Daily chart and then use the Perfect Trend Line Indicator on H1 or M15 for entry timing.
This approach helps avoid trading against the dominant market movement.
Download This MT5 Indicator for Free
Indicator Chart Setup
After applying the indicator to a MetaTrader 5 chart, two trend lines appear together with colored dots that highlight possible trading opportunities.
The indicator also modifies candle colors when strong momentum is detected.
Blue candles and dots indicate bullish conditions, while red candles and dots show bearish momentum.
During neutral market conditions, candles remain unchanged, helping traders avoid unnecessary signals during sideways movement.
Core Features
- Uses fast and slow trend lines to identify market direction.
- Displays visual buy and sell signals.
- Plots blue and red trend dots on the chart.
- Changes candle colors based on momentum.
- Helps identify trend reversals.
- Works on all MetaTrader 5 timeframes.
Best for
- Trend-following strategies.
- Momentum trading.
- Entry and exit timing.
- Market direction analysis.
- Higher timeframe trend confirmation.
- Beginner-friendly technical analysis.
Best Markets
- EUR/USD, GBP/USD, USD/JPY, and EUR/GBP.
- Gold (XAU/USD).
- NASDAQ 100 and Dow Jones.
- Bitcoin and Ethereum.
- Crude Oil.
- Major stock CFDs.
Trading Styles
- Swing trading on H4 and Daily charts.
- Intraday trading on H1 and M30.
- Trend entries on M15 charts.
- Momentum trading during strong market sessions.
- Breakout continuation strategies.
- Multi-timeframe trend analysis.
How Traders Use It
A bullish setup occurs when a blue dot appears and the fast blue trend line crosses above the slower red trend line.
Forex traders often wait for price confirmation before entering a buy position, with stop-loss placement below a recent swing low or technical support area.
A bearish setup develops when a red dot appears and the red trend line moves above the blue trend line.
This suggests that sellers are gaining control and may provide a short-selling opportunity.
The appearance of an opposite color signal can also be used as a possible exit indication.
For stronger results, many traders combine the indicator with higher timeframe trend analysis.
For example, if the Daily chart shows a bullish trend, traders can wait for a blue signal on the H1 chart before entering long positions.
This keeps trades aligned with the broader market direction.
Get Instant Free Access
Indicator Settings
- FastLength: Sets the calculation period of the fast trend line. The default value is 3.
- SlowLength: Defines the calculation period of the slow trend line.
- Style: Adjusts the visual style of the indicator lines.
- Colors: Customize the appearance of trend lines, dots, and signals.
Important Notes
- The indicator performs better on higher timeframes where market trends are clearer.
- Lower timeframes may produce more frequent signals during sideways markets.
- Combine with higher timeframe trend analysis for improved trade selection.
- Use price action confirmation before entering trades.
- Trend indicators work best when used with proper risk management.
- Suitable for forex, indices, commodities, cryptocurrencies, and stocks.









