
The ADR indicator for MT5 is a useful market range tool that displays the Average Daily Range of a financial instrument directly on the chart.
It helps traders understand how far price has typically moved during a trading day and highlights potential areas where the market may slow down, reverse, or continue its movement.
Daily range analysis is widely used by intraday traders because many currency pairs follow repeating volatility patterns.
By knowing the expected daily movement, traders can better evaluate whether the current price is trading near an extreme level or still has room to continue.
The indicator automatically calculates the average range using historical price data and displays the upper and lower ADR boundaries.
These levels can act as reference points for breakout strategies, reversal setups, and intraday trade management.
Why traders use the ADR Indicator
The Average Daily Range provides valuable information about market volatility.
Instead of analyzing price movement without context, traders can compare the current day’s range with the normal movement of the instrument.
When price approaches the upper ADR level, it may indicate that buyers have pushed the market close to its typical daily limit.
This area can become interesting for reversal setups, especially when combined with candlestick patterns or momentum confirmation.
The lower ADR level works in the same way.
If sellers push price toward this zone, traders can monitor whether selling pressure continues or whether buyers begin defending the area.
The indicator is suitable for both beginners learning intraday market behavior and experienced traders who want to add volatility analysis to an existing strategy.
Download This MT5 Indicator for Free
Indicator Chart Setup
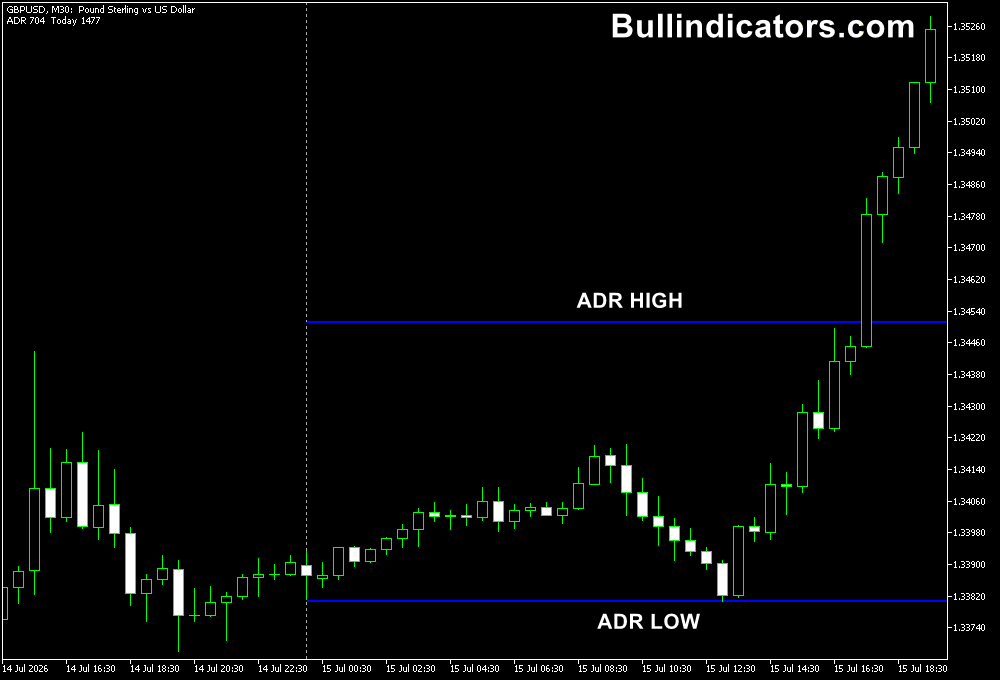
After applying the ADR Indicator to an MT5 chart, the current Average Daily Range information appears on the chart together with the upper and lower ADR levels.
The indicator displays the expected daily movement range using horizontal lines that extend throughout the trading day.
These levels allow you to quickly identify whether price is trading near the daily high, daily low, or within the normal range.
The ADR calculation is based on the Average True Range (ATR) concept.
Because every market has different volatility characteristics, the selected calculation period can influence how wide or narrow the displayed range becomes.
Core Features
- Displays the Average Daily Range directly on the MT5 chart
- Shows upper and lower daily range boundaries
- Helps identify potential intraday reversal zones
- Useful for breakout and range trading strategies
- Based on ATR volatility calculations
- Adjustable time zone settings
Best for
- Intraday market analysis
- Daily range breakout setups
- Reversal trading near price extremes
- Setting realistic profit targets
- Volatility-based trade planning
Best Markets
- EUR/USD, GBP/USD, and USD/JPY for daily range analysis
- Gold (XAU/USD), where volatility expansion creates strong ADR movements
- GBP crosses such as GBP/JPY during active sessions
- Major stock indices like NAS100 and US30
- Crude oil and other instruments with consistent daily volatility
- Liquid markets with clear intraday price movement
Trading Styles
- Intraday trading
- London session strategies
- New York session trading
- Range reversal setups
- Breakout strategies
- Price action trading
How traders use it
The ADR Indicator can be applied in several ways depending on the market condition.
Many traders use it to identify areas where price may react after making a strong intraday move.
A common reversal approach is to wait until price reaches one of the ADR boundaries and then look for confirmation.
For example, if EUR/USD reaches the upper ADR level and forms a bearish engulfing candle, this can indicate that buyers are losing momentum.
A short position may be considered with a stop loss above the recent swing high.
The lower ADR level can be used for bullish setups.
When price reaches the lower range and creates a strong rejection candle, traders can look for buying opportunities with a target toward the middle or upper ADR area.
The indicator can also support breakout strategies.
If price breaks above the ADR high with strong momentum and increased volume, it may signal that the market is entering an unusually strong trend day.
For example, a trader can combine ADR levels with a trend indicator.
If the overall trend is bullish and price retraces toward the lower ADR zone, the trader can wait for a bullish confirmation signal before entering in the direction of the main trend.
Get Instant Free Access
Indicator Settings
- TimeZoneOfDate: Adjusts the broker time zone settings to ensure the daily range is calculated correctly.
- TimeZoneOfSession: Allows adjustment of the trading session time zone used by the indicator.
- Colors: Customizes the appearance of ADR lines and displayed information.
Important Notes
- ADR levels are based on historical volatility and do not predict future price direction.
- Different instruments have different average daily movements, so settings may require adjustment.
- The indicator works best when combined with price action or trend confirmation tools.
- High-impact news events can cause price to exceed normal ADR values.
- Lower timeframes such as M15 and M30 are commonly used for ADR-based intraday setups.









