
The Key Reversal indicator for MT5 is a trend reversal tool that identifies potential turning points in the market and displays buy and sell signals directly on the chart.
The indicator analyzes price swings and uses reversal patterns to locate possible changes between bullish and bearish momentum.
Based on a modified ZigZag calculation, the indicator searches for important highs and lows and marks these areas with arrows.
This makes it easier to recognize possible trend changes without manually analyzing every market swing.
This technical tool is suitable for swing traders who want to follow larger market movements, but it can also be applied to intraday charts when combined with additional confirmation tools.
Since reversal signals can appear against strong trends, verifying the signal with the higher timeframe direction can significantly improve trade quality.
Why traders use the Key Reversal Indicator
Market reversals often create some of the best trading opportunities because they allow traders to enter near the beginning of a new price movement.
The challenge is identifying whether a price swing represents a real trend change or only a temporary pullback.
The Key Reversal Indicator simplifies this process by automatically highlighting potential reversal areas with visual arrows.
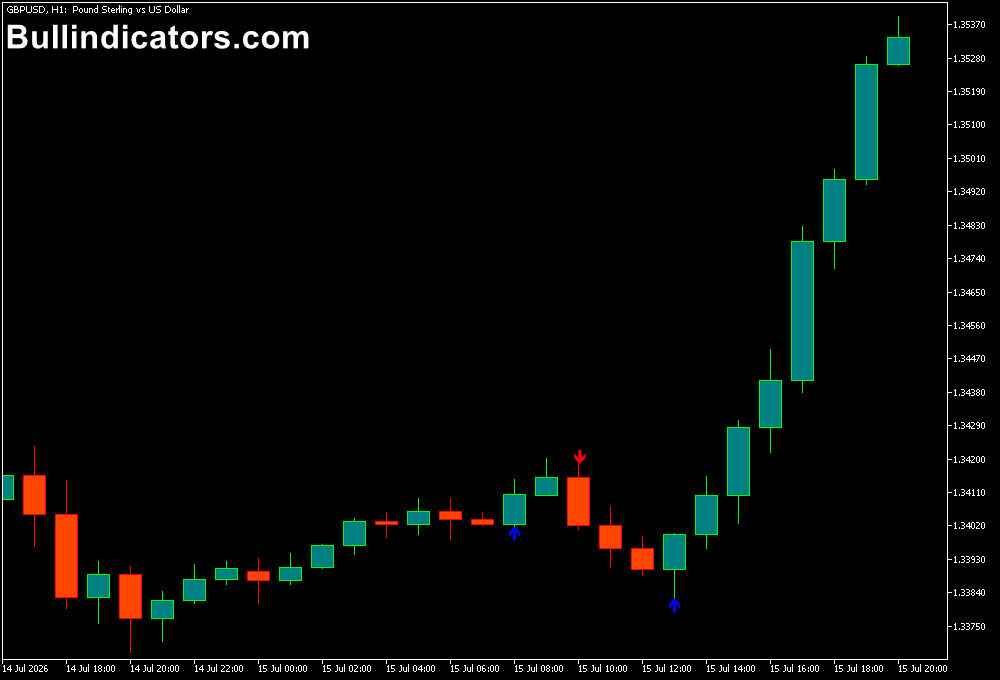
A blue or upward signal indicates a possible bullish move, while a downward arrow suggests increasing selling pressure.
Many experienced traders combine reversal indicators with trend filters.
For example, a bullish reversal signal becomes stronger when it appears during a larger uptrend.
Checking the direction of a higher timeframe trend can help remove lower-quality signals and create better trade opportunities.
Download This MT5 Indicator for Free
Indicator Chart Setup
After applying the indicator to an MT5 chart, it continuously scans price movements and searches for significant swing points.
When a potential reversal area is detected, an arrow appears above or below the candle.
The indicator calculates market turning points using trend period, deviation, and filtering logic.
Larger settings reduce minor market fluctuations and focus on more important price movements, while smaller settings create more frequent signals.
The chart remains clean because the indicator focuses mainly on reversal arrows and does not overload the screen with unnecessary objects.
Core Features
- Automatic detection of potential trend reversals
- Buy and sell arrows displayed directly on the chart
- Based on price swing and ZigZag reversal logic
- Suitable for swing and intraday trading
- Optional trend filtering system
- Built-in signal alerts
Best for
- Identifying market turning points
- Swing trading setups
- Trend continuation entries after pullbacks
- Intraday reversal analysis
- Combining with price action strategies
Best Markets
- EUR/USD and GBP/USD for clean technical movements
- USD/JPY during strong directional trends
- Gold (XAU/USD), where major swings create strong reversal zones
- Stock indices such as NAS100 and US30
- Major cryptocurrency pairs with clear volatility cycles
- Liquid markets where swing points are easier to identify
Trading Styles
- Swing trading
- Trend reversal trading
- Intraday pullback trading
- Breakout confirmation strategies
- Multi-timeframe trading
- Price action based strategies
How traders use it
The Key Reversal Indicator is commonly used by waiting for an arrow signal and then checking whether the setup agrees with the overall market direction.
A higher timeframe trend filter can improve accuracy because it helps avoid trading against strong market momentum.
For example, if the daily or H4 trend is bullish, traders can focus mainly on buy signals appearing after temporary price corrections.
Long Trade Example
Assume EUR/USD is moving in an uptrend on the H4 chart.
The price makes a temporary pullback toward a previous support area.
The Key Reversal Indicator prints an upward arrow on the M15 chart, showing a possible bullish reversal.
- Confirm that the higher timeframe trend remains bullish.
- Wait for the bullish reversal arrow to appear.
- Enter a buy position after confirmation from the candle pattern.
- Place the stop loss below the recent swing low.
- Manage the trade until an opposite reversal signal appears or a target level is reached.
Short Trade Example
Suppose GBP/USD is showing a bearish trend on the daily chart.
During a retracement, price moves toward a resistance zone and the Key Reversal Indicator displays a downward arrow.
- Verify that the higher timeframe direction remains bearish.
- Wait for the sell arrow and confirmation candle.
- Open a short position after the reversal setup develops.
- Place the stop loss above the recent swing high.
- Exit when momentum weakens or an opposite signal appears.
Get Instant Free Access
Indicator Settings
- Trend Period: Determines the calculation period used to identify reversal movements.
- Use Trend Filter: Enables additional filtering to reduce weaker signals.
- Show Alerts: Activates notifications when new signals appear.
Important Notes
- The indicator may require confirmation because reversal calculations can adjust when new price data appears.
- Higher timeframe trend verification can help improve signal accuracy.
- Combining signals with support and resistance, moving averages, or price action can create stronger setups.
- Larger Trend Period values create fewer but potentially stronger reversal signals.
- No indicator can predict every market turning point, so proper risk management remains essential.









