
The ADR Order Block Finder indicator for MT4 combines average daily range analysis with bullish and bearish price levels.
Rather than producing conventional BUY and SELL arrows, it shows where buying and selling pressure is developing and helps identify areas where price may continue or react.
This makes the tool particularly useful when combined with the broader market trend.
A practical approach is to look for long opportunities during bullish conditions and use market rallies to search for short setups when the overall direction is bearish.
It can be used across short-term and higher timeframes, making it suitable for scalping, intraday trading, and swing analysis.
Why traders use the ADR Order Block Finder
One of its main advantages is that it adds a volatility perspective to the chart.
The bullish and bearish readings indicate the distance between opposing price movements, while the ADR component provides context for how much the market has already moved.
This can be useful when judging whether a currency pair still has room to move or whether price has already travelled a significant portion of its typical range.
The information becomes more valuable when combined with support and resistance, price action, or a separate trend-following method.
Download This MT4 Indicator for Free
Indicator Chart Setup
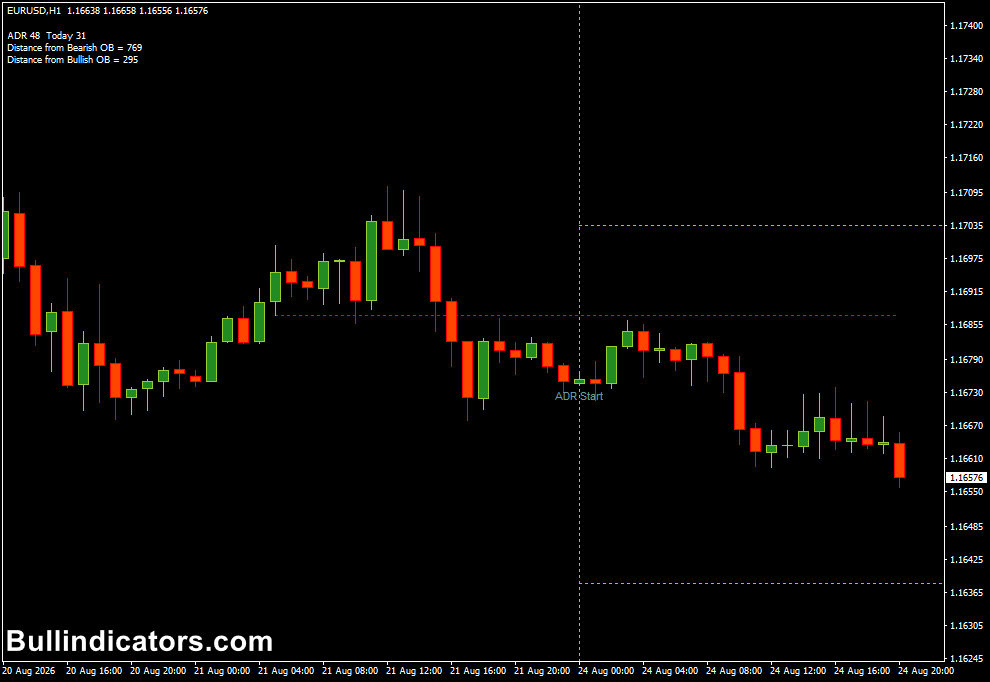
The ADR Order Block Finder displays bullish and bearish information using two differently colored lines.
Aqua represents the bullish side, while red represents the bearish side.
The relative position and development of these readings can help determine which side currently has greater momentum.
There is no requirement to restrict the tool to one timeframe.
On lower charts, it can help with short-term market timing, while H1, H4, and daily charts provide a broader view of the current price environment.
Core Features
- Displays bullish and bearish ADR information directly on the chart.
- Uses separate Aqua and red colors for buying and selling conditions.
- Includes ADR and ATR-based calculations to measure market activity.
- Can be applied to virtually any MT4 timeframe.
- Useful for combining volatility analysis with price action.
- Works well as a market-context tool rather than relying on one isolated signal.
Best for
- Finding potential continuation areas in an established trend.
- Assessing whether a market has already covered a substantial daily range.
- Filtering short-term entries with higher-timeframe direction.
- Identifying bullish conditions for buying dips.
- Identifying bearish conditions for selling rallies.
Best Markets
- EURUSD and GBPUSD are excellent choices because of their liquidity and active intraday movement.
- USDJPY can provide useful setups when directional momentum is strong.
- GBPJPY suits more aggressive short-term approaches because of its larger price swings.
- Gold (XAUUSD) can also be interesting when volatility expands, although position sizing should reflect its larger movements.
- Major currency pairs generally provide the most consistent environment for interpreting ADR-based information.
Trading Styles
- Scalping on M1, M5, and M15 when aligned with the dominant trend.
- Intraday trading using M15, M30, and H1 for more selective entries.
- Swing trading with H4 and daily charts to identify the broader directional bias.
- Trend-following strategies where ADR readings are used as confirmation rather than the sole entry trigger.
How traders use it
The most important rule is to keep the general trend in mind.
When the market is bullish, look for opportunities to buy dips rather than chasing extended upward candles.
When the market is bearish, rallies can provide better locations for short positions.
Practical trading tips
For example, suppose EURUSD is making higher highs and higher lows on H1.
If price pulls back toward a previous support area while the bullish ADR reading remains dominant, a trader could wait for a bullish price-action signal before entering a BUY trade.
The recent swing low can provide a logical reference for the stop loss, while the previous high or another resistance area can be used as a profit target.
Now consider GBPUSD during a bearish H1 trend.
A temporary rally moves price into previous resistance while the bearish ADR reading remains stronger.
Rather than buying into that rally, a trader can wait for rejection and use the move back downward as a potential SELL setup. The recent swing high provides a natural area for risk control.
This trend-based approach is particularly useful on lower timeframes.
A scalper can use M5 or M15 for the entry while checking H1 or H4 to establish the general direction.
This reduces the temptation to take every bullish or bearish fluctuation as an independent signal.
Get Instant Free Access
Indicator Settings
- Buy: Sets the color used for bullish readings. The default is Aqua.
- SELL: Sets the color used for bearish readings. The default is red.
- arrow_width: Controls the width of the displayed arrows. The default value is 2.
- XXX: Provides the ADR-related settings section.
- TimeZoneOfData: Defines the timezone used for the market data. The default is 0.
- TimeZoneOfSession: Defines the session timezone. The default is 0.
- ATRPeriod: Controls the ATR calculation period. The default value is 5.
Important Notes
- The tool can be used on any timeframe, but the quality of a setup depends heavily on the surrounding market conditions.
- Always establish the general trend before acting on bullish or bearish readings.
- In a bullish market, focus on buying dips near meaningful support rather than entering after an extended rally.
- In a bearish market, look for rallies into resistance as potential shorting opportunities.
- ADR information should be combined with price action, support and resistance, or another confirmation method.
- Be particularly careful when price has already travelled an unusually large portion of its normal daily range.
- Risk management remains essential, especially on volatile instruments such as GBPJPY and XAUUSD.









