
The RSI 3TF Alert indicator for MT4 combines three RSI calculations to give a broader view of market momentum.
It produces BUY and SELL arrows while comparing RSI readings across multiple timeframes, allowing short-term signals to be assessed against the larger market move.
The central 50 level plays an important role in interpreting the signals.
When the RED and AQUA RSI lines are above 50, bullish momentum has stronger support.
When they remain below 50, bearish pressure is more dominant.
This makes the tool particularly useful when you want to filter short-term entries according to the direction of the wider move.
It can be used across different markets and timeframes, from M1 and M5 scalping to H1 and H4 trend trading.
EURUSD, GBPUSD, USDJPY and GBPJPY are natural markets to test, while gold can also produce strong momentum setups during active sessions.
Why traders use the RSI 3TF Alert Indicator
A single RSI reading can sometimes give a misleading picture because momentum on a lower timeframe may move against the prevailing trend.
The three-timeframe approach helps put that signal into context.
The arrow alerts make potential entry points easy to spot, while the additional RSI readings can be used as a directional filter.
This combination is particularly useful for short-term setups where timing matters.
The timeframe inputs can be configured manually or allowed to select higher timeframes automatically.
This means the same tool can be adapted for a fast scalping strategy or a slower intraday approach.
Download This MT4 Indicator for Free
Indicator Chart Setup
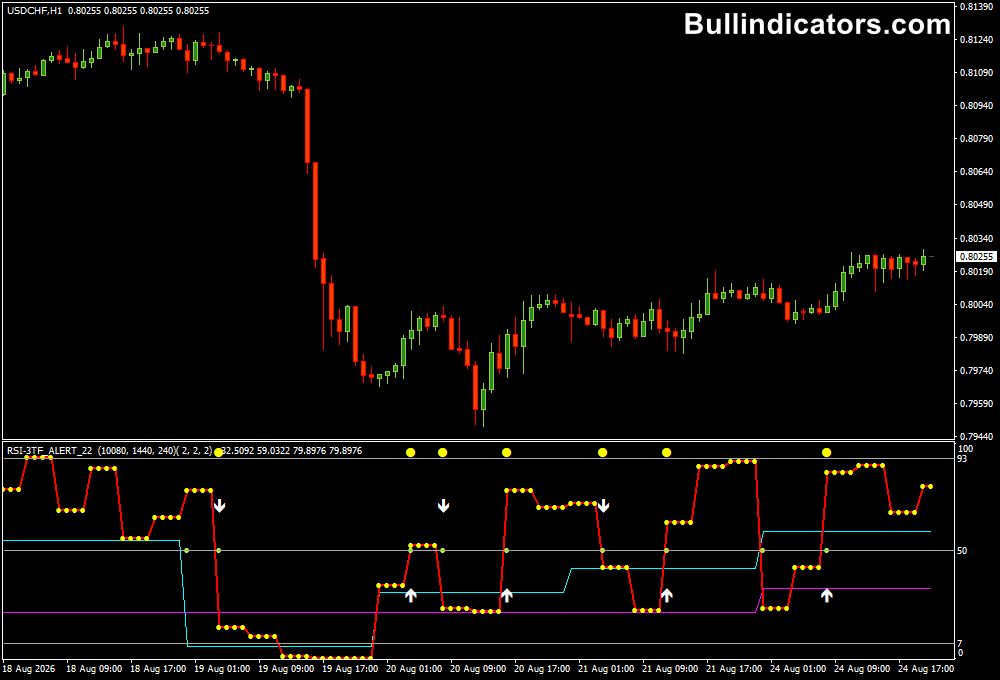
The RSI 3TF Alert Indicator displays three RSI lines in the indicator window.
The MAJENTA, AQUA and RED lines represent the different RSI calculations, while YELLOW arrows mark potential BUY and SELL signals.
Three reference levels are also displayed around 7, 50 and 93.
The 50 level is the most important for directional analysis.
A BUY arrow accompanied by RED and AQUA readings above 50 generally provides a stronger bullish setup.
For bearish conditions, look for the opposite relationship with both readings below 50.
Core Features
- Three RSI calculations combined into one MT4 tool.
- BUY and SELL arrow signals.
- Multi-timeframe momentum analysis.
- 50-level directional filter.
- Configurable RSI periods.
- Automatic higher-timeframe selection when TF values are set to 0.
- Alert functionality for trading signals.
Best for
- Filtering short-term RSI signals with higher-timeframe momentum.
- Finding continuation setups during established trends.
- Timing pullback entries on lower timeframes.
- Confirming momentum before entering a breakout.
- Identifying potential changes in market direction.
Best Markets
- EURUSD: A strong candidate for M1, M5 and M15 momentum setups, particularly during London and New York.
- GBPUSD: Useful when the pair develops a sustained intraday move.
- USDJPY: Well suited to momentum-based setups during active Asian and London sessions.
- GBPJPY: Its larger price movements can provide attractive short-term opportunities, although position sizing should reflect the higher volatility.
- XAUUSD: Worth testing during periods of strong directional movement, especially around the London-New York overlap.
Trading Styles
- M1 and M5 scalping.
- M15 and M30 intraday trading.
- H1 momentum trading.
- Pullback and trend-continuation strategies.
- Breakout confirmation.
- Multi-timeframe discretionary trading.
How traders use it
A straightforward approach is to use the arrow as the initial signal and the higher-timeframe RSI readings as confirmation.
For a BUY setup, look for an UP arrow while the RED and AQUA lines are above 50. A SELL setup is stronger when a DOWN arrow appears while both readings are below 50.
For M5 scalping on EURUSD, for example, a BUY arrow following a small pullback can be considered when the RED and AQUA lines remain above 50.
A break above the signal candle’s high can provide an additional entry trigger.
The stop can be positioned beneath the recent swing low, with the next resistance area or a predefined risk-to-reward target used for profit taking.
The same principle works in reverse for a short trade.
On GBPJPY, a DOWN arrow near resistance combined with RED and AQUA readings below 50 provides a bearish setup.
A break beneath the signal candle can be used as confirmation, while the stop can be placed above the recent swing high.
Price location remains important.
Signals appearing directly into major support or resistance deserve more caution, while signals that agree with a developing trend or a clean pullback generally offer a better trading context.
Get Instant Free Access
Indicator Settings
- RSI_Period_1: Sets the calculation period for the first RSI.
- RSI_Period_2: Defines the second RSI period.
- RSI_Period_3: Controls the third RSI calculation.
- RSI_Period_B1: Sets the first B-period calculation.
- RSI_Period_B2: Sets the second B-period calculation.
- RSI_Period_B3: Sets the third B-period calculation.
- TF1: Selects the first timeframe. A value of 0 automatically chooses the next higher timeframe.
- TF2: Selects the second timeframe. With 0, the next two higher timeframes are used.
- TF3: Selects the third timeframe. With 0, the next three higher timeframes are used.
- Colors: Controls the appearance of the RSI lines and signals.
- Line style: Adjusts the style of the plotted lines.
Important Notes
- The 50 level is an important filter when assessing the direction of momentum.
- Do not treat every arrow as an automatic entry signal.
- Higher-timeframe agreement can help filter weaker M1 and M5 signals.
- Support, resistance and recent swing points should be considered before entering.
- Volatile markets such as GBPJPY and XAUUSD require appropriate position sizing.
- Test the RSI periods and timeframe combination on the market and trading session you intend to trade.









