
The Better Volume Alerts Indicator for MT4 uses volume analysis to help assess the relationship between trading activity and price movement.
Based on BetterVolume 1.5, it compares current volume with historical volume levels, helping identify periods when activity is unusually strong or weak.
The volume bars can provide useful information about momentum, market participation and potential exhaustion.
A strong increase in volume accompanying a directional move can support the underlying price action, while high volume with limited price progress may warn that the current move is losing strength.
For Forex, the tool works with tick volume, which measures the number of price changes during each candle.
This makes it particularly useful for intraday analysis, where changes in activity can help confirm whether a move has meaningful participation behind it.
Why traders use the Better Volume Alerts Indicator
Volume is most useful when it is compared with price action.
A rising market accompanied by increasing volume can suggest that buyers are actively participating.
Conversely, heavy volume near a failed high or low can point to exhaustion, rejection or a possible reversal.
The Better Volume approach makes these changes easier to monitor through color-coded volume bars.
This can help identify momentum bursts, unusual activity and situations where price and volume are no longer confirming each other.
It is particularly useful for intraday Forex trading because the strongest market moves often occur when participation increases during major trading sessions.
Download This MT4 Indicator for Free
Indicator Chart Setup
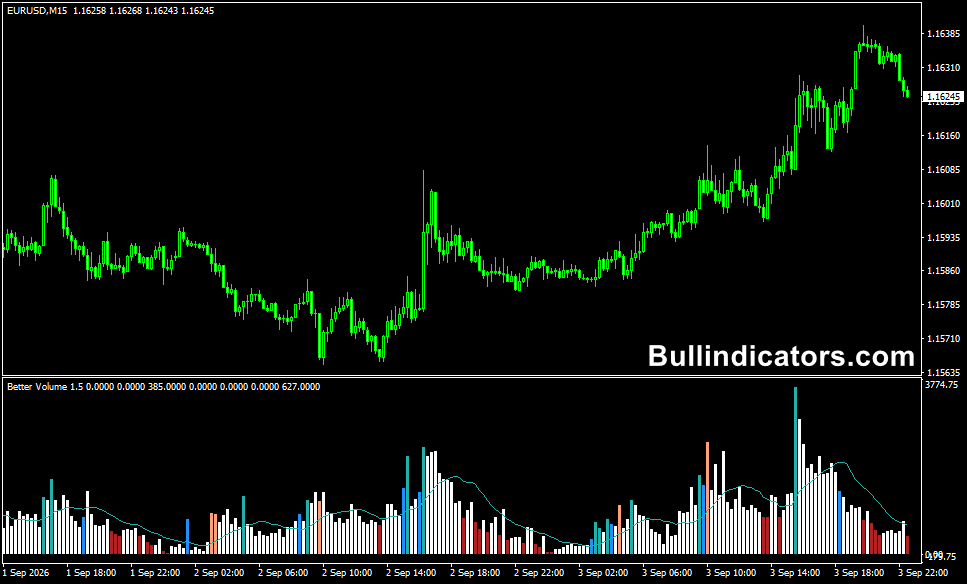
The chart displays a volume histogram below the price candles, with different bar colors representing different volume conditions.
The MA-Period and LookBack parameters determine how the volume readings are calculated and compared with previous activity.
When volume expands significantly, the larger bars can draw attention to important market events.
The relationship between these bars and the corresponding candles is essential.
Strong volume with a decisive breakout can support continuation, while strong volume combined with rejection may provide an early warning of a reversal.
Core Features
- Based on BetterVolume 1.5 volume analysis.
- Uses tick volume for Forex market analysis.
- Compares current activity with previous volume levels.
- Displays positive and negative volume bars.
- Helps identify unusual increases in market participation.
- Useful for momentum, exhaustion and reversal analysis.
- Includes an optional visual alert function.
Best for
- Confirming momentum behind price movements.
- Identifying unusually active candles.
- Spotting potential exhaustion near important highs and lows.
- Analyzing breakouts and rejection patterns.
- Short-term intraday and scalping analysis.
Best Markets
- EUR/USD – particularly useful during the London and US sessions when liquidity and activity increase.
- GBP/USD – suitable for momentum-based intraday setups.
- USD/JPY – useful for assessing volume expansion around directional moves.
- Gold (XAU/USD) – can provide additional context during strong volatility, although risk controls should be adjusted accordingly.
Trading Styles
- Forex scalping on M1 and M5 charts.
- Intraday momentum trading.
- Breakout confirmation.
- Price-action trading with volume confirmation.
- Reversal and exhaustion analysis.
How traders use it
The key is to read the volume together with price rather than treating a large bar as an automatic buy or sell signal.
For example, a bullish candle breaking above resistance while volume expands can provide stronger confirmation than the same breakout occurring on weak activity.
A different situation occurs when volume rises sharply but price fails to continue.
If buyers push volume higher but the market repeatedly rejects new highs, the lack of progress can indicate exhaustion and increase the probability of a pullback.
EURUSD Scalping Trading Example
For a EUR/USD scalping approach, the London and US sessions offer suitable periods for monitoring changes in activity.
One possible method for targeting 8–15 pips is:
- Focus on EUR/USD during the most active part of the London or US session.
- Use the M1 or M5 chart to locate a clear short-term price level, breakout or rejection.
- Look for a noticeable increase in volume when price begins moving away from the level.
- For a long setup, favor bullish price action supported by expanding volume.
- For a short setup, look for bearish candles and increasing volume as price moves lower.
- Enter only when price action and volume agree rather than relying on the volume bar alone.
- Use a predefined stop-loss and aim for approximately 8–15 pips when the market has enough momentum to support the target.
- Consider reducing the target or skipping the setup when price reaches nearby support or resistance before producing sufficient movement.
Get Instant Free Access
Indicator Settings
- MA-Period: Sets the moving average period used for the volume calculation.
- LookBack: Defines how many previous candles are considered when calculating and comparing volume.
- Width1: Controls the width of the positive volume bars.
- Width2: Controls the width of the negative volume bars.
- Use VisualAlert: Enables on-screen alerts when the relevant volume condition occurs.
Important Notes
- Volume analysis provides market information rather than guaranteed buy or sell signals.
- Forex volume is based on tick activity rather than centralized exchange-traded lot volume.
- Always compare volume readings with the corresponding price action.
- Very low timeframes can produce frequent changes in volume, so additional confirmation can improve signal quality.
- Targets of 8–15 pips are market-dependent and should not be forced when volatility is insufficient.
- Use appropriate risk management and test the strategy on historical data or a demo account before committing real capital.









