
The Bollinger Bands Indicator for MT4 is a versatile technical tool for reading volatility, trend direction and potential price turning points.
It consists of a central moving average together with an upper and lower band that expand and contract according to market volatility.
The three-line setup gives a useful reference for judging whether price is moving strongly, consolidating or approaching an area where a reaction may develop.
When the bands widen, volatility is increasing, while narrower bands indicate quieter market conditions.
It can be used across virtually any timeframe and suits scalping, intraday trading, swing trading and longer-term analysis.
The same basic concept can be adapted to different markets and strategies.
Why traders use the Bollinger Bands Indicator
Bollinger Bands are popular because they combine trend and volatility information in one chart tool.
The middle line provides a reference for the prevailing price direction, while the outer bands show how far price is moving from its average.
The outer bands can also act as dynamic areas of potential support and resistance.
However, a touch of the upper or lower band does not automatically mean a reversal. Strong trends can continue to push along an outer band for extended periods.
This makes the bands particularly useful when combined with candlestick formations, market levels or momentum confirmation.
RSI and MACD can also provide additional confirmation when assessing potential reversal or breakout setups.
Download This MT4 Indicator for Free
Indicator Chart Setup
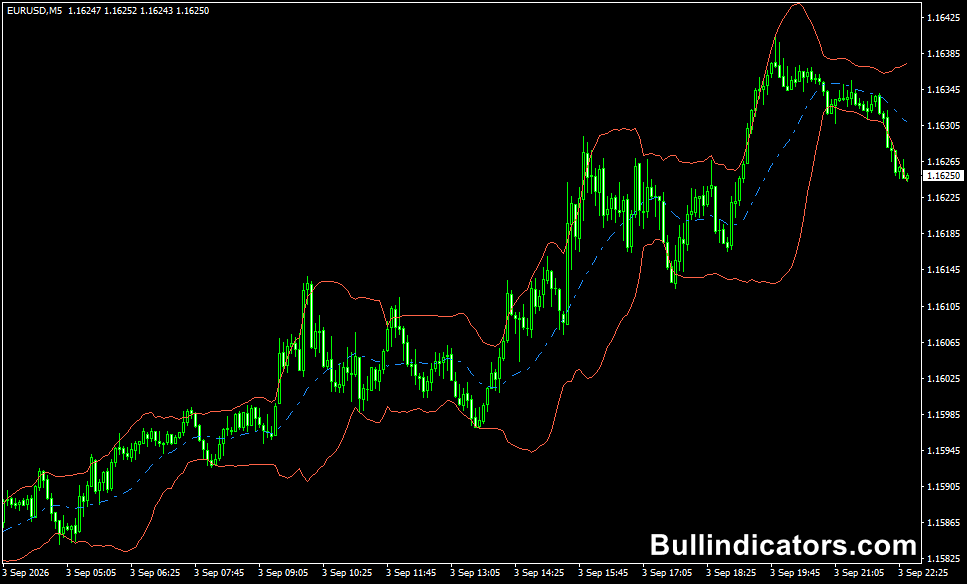
The MT4 chart displays a middle moving-average line with an upper and lower volatility band surrounding price.
The distance between the bands changes as volatility rises or falls, allowing market conditions to be assessed at a glance.
The default configuration uses a 20-period calculation, zero shift and 2.0 standard deviations.
These parameters can be adjusted to make the bands more responsive or more selective depending on the timeframe and trading approach.
Core Features
- Three-line Bollinger Bands structure.
- Central moving average for directional reference.
- Dynamic upper and lower volatility bands.
- Band expansion highlights increasing volatility.
- Band contraction identifies quieter market conditions.
- Useful for breakout, pullback and reversal analysis.
- Suitable for all MT4 timeframes.
Best for
- Measuring current market volatility.
- Following directional moves using the middle band.
- Identifying potential breakout conditions after consolidation.
- Locating possible reversal areas near the outer bands.
- Confirming price-action setups.
- Building strategies for both short- and longer-term trading.
Best Markets
- EUR/JPY – effective for intraday setups where volatility creates extended moves.
- EUR/USD – suitable for both scalping and session-based trading.
- GBP/USD – useful when momentum expands during London and US trading hours.
- USD/JPY – well suited to trend and pullback strategies.
- Gold (XAU/USD) – useful for volatility analysis, provided position sizing reflects its larger price swings.
Trading Styles
- Scalping on M1, M5 and M15 charts.
- Intraday momentum trading.
- Breakout strategies following periods of narrow bands.
- Range trading when price oscillates between the outer bands.
- Swing trading on H1 and H4 charts.
- Longer-term trend analysis on daily charts.
How traders use it
There are several ways to incorporate Bollinger Bands into a trading plan.
In a trending market, price holding above the middle line can support a bullish bias, while repeated trading below it can favor bearish conditions.
The outer bands can then help assess momentum and possible areas for taking profit or waiting for a reaction.
For breakout trading, a period of compressed bands can attract attention because a volatility expansion may follow.
A decisive candle breaking from the consolidation area, supported by strong price action, can provide a more meaningful setup than simply entering because the bands have narrowed.
For reversal setups, a touch of an outer band becomes more interesting when accompanied by a rejection candle, engulfing pattern or another sign that momentum is changing.
This approach is more reliable than assuming every upper-band or lower-band touch will produce a reversal.
M15 EURJPY Example
A practical example can be seen on an M15 EUR/JPY chart.
Suppose price is trending upward and repeatedly holds above the middle band.
A bullish pullback toward the middle or lower portion of the bands can be monitored for a rejection before the next move higher.
If momentum resumes and price reaches the next significant resistance area, a position could capture a move of around 50 pips.
The result depends on the actual market conditions; the 50-pip gain is an example of how the setup can be traded rather than a guaranteed outcome.
Get Instant Free Access
Indicator Settings
- BandsPeriod: Sets the period used for the Bollinger Bands calculation.
- BandsShift: Determines the horizontal shift used when drawing the bands.
- BandsDeviations: Sets the standard deviation distance between the middle line and outer bands.
- Colors: Controls the colors used for the Bollinger Bands lines.
- Line Style: Determines how the bands are displayed on the chart.
- Extra: Additional visual options may be available depending on the MT4 version of the file.
Important Notes
- A price touch of an outer band is not automatically a reversal signal.
- Strong trends can remain near an outer band while continuing in the same direction.
- Use candle confirmation, market structure or another technical method before entering a position.
- Shorter settings can produce faster signals but may also increase market noise.
- Higher settings can filter more short-term movement and suit broader trend analysis.
- The indicator works across different trading styles, but the settings and timeframe should match the strategy.









