
The CPR (Central Pivot Range) indicator for MT4 is an advanced pivot-based tool designed to identify important daily price levels and potential support and resistance zones.
It calculates central pivot areas using three key levels: the Central Pivot (CP), Top Central Pivot (TC), and Bottom Central Pivot (BC).
Pivot points are widely used by intraday traders because they highlight areas where price may react, reverse, or continue its current movement.
The CPR Indicator adds more depth to traditional pivot analysis by displaying additional support and resistance levels based on previous price action.
Why traders use CPR Indicator
The CPR Indicator helps traders quickly locate important market areas without manually calculating pivot levels.
The central pivot range provides insight into the current market bias, while the surrounding support and resistance lines help identify possible entry zones, targets, and risk management areas.
When price trades above the central pivot range, it can indicate stronger buying pressure.
A price position below the CPR zone may suggest bearish momentum.
This makes the indicator useful for analysing market direction before entering short-term or intraday trades.
Download This MT4 Indicator for Free
Indicator Chart Setup
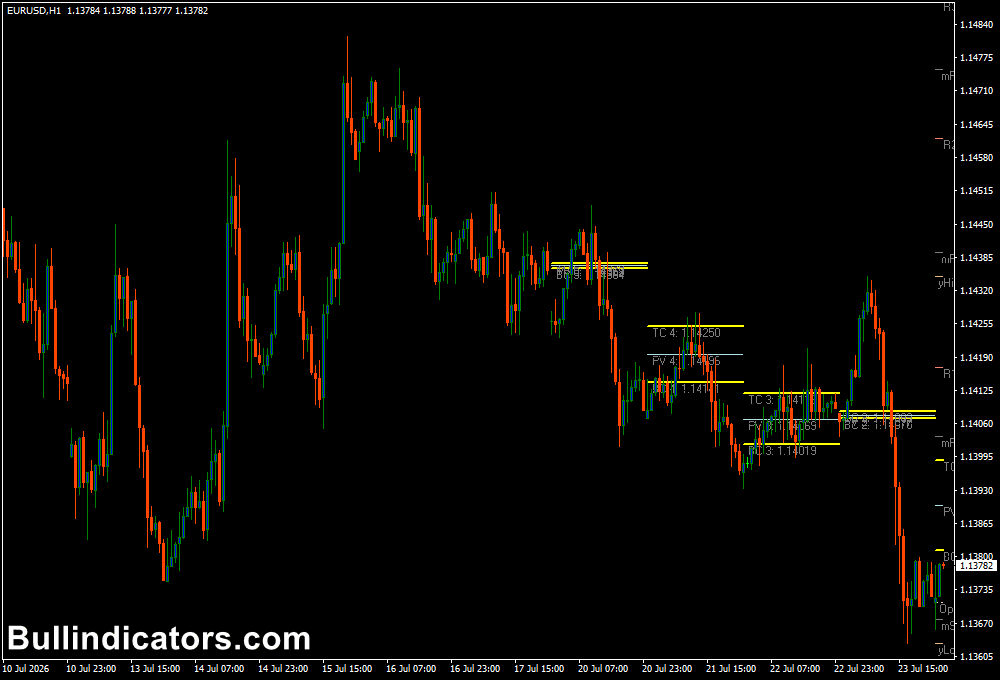
After applying the CPR Indicator to a MetaTrader 4 chart, traders will see a central pivot zone displayed together with multiple horizontal support and resistance levels.
The indicator automatically calculates these levels based on the selected timeframe.
The chart displays the central pivot area along with additional pivot zones that can be used to monitor possible breakout points, reversal areas, and profit targets.
The visual layout makes it easier to analyse price behaviour around important levels.
Core Features
- Displays the Central Pivot Range with TC, BC, and pivot levels.
- Automatically calculates important support and resistance areas.
- Provides daily, weekly, and monthly pivot analysis.
- Shows Fibonacci pivot levels for additional market reference.
- Helps identify possible breakout and reversal zones.
- Works on multiple currency pairs and timeframes.
Best for
- Finding intraday support and resistance levels.
- Analysing market direction before opening trades.
- Planning entry points, stop-loss levels, and targets.
- Combining pivot analysis with candlestick patterns.
- Improving technical analysis on lower timeframes.
Best Markets
- Major Forex pairs such as EUR/USD, GBP/USD, and USD/JPY.
- Gold (XAU/USD) where daily levels often influence price reactions.
- Stock indices including NASDAQ, DAX, and S&P 500.
- Silver and other commodities with strong intraday movements.
- Cryptocurrency markets where key price zones are important.
Trading Styles
- Day trading strategies on M15 and H1 charts using pivot reactions.
- Scalping setups on M5 charts around CPR support and resistance zones.
- Breakout trading when price moves beyond important pivot levels.
- Intraday trend following on EUR/USD, GBP/JPY, or gold charts.
- Short-term reversal strategies using candlestick confirmation.
How traders use it
The CPR Indicator is commonly used as a market analysis tool rather than a standalone signal generator.
Traders monitor how price reacts around the central pivot range and surrounding support or resistance levels.
A bullish scenario may develop when price remains above the central pivot and breaks through higher resistance levels.
A bearish setup can appear when price stays below the pivot range and moves toward lower support areas.
Combining CPR levels with indicators such as moving averages, trendlines, or price action patterns can provide additional confirmation.
Get Instant Free Access
Indicator Settings
- Pivot Point Timeframe: Select the timeframe used for calculating the Central Pivot Range.
- Hide Labels: Enable or disable additional information displayed near pivot lines.
- Show_1Daily_2FibonacciPivots: Controls the number of Fibonacci pivot levels displayed.
- Daily Pivot Settings: Adjust daily pivot calculations according to trading preferences.
- Weekly Pivot Settings: Allows weekly pivot level analysis.
- Monthly Pivot Settings: Displays longer-term pivot zones.
- Line colours and display options can be adjusted according to chart preferences.
Important Notes
- The CPR Indicator does not generate automatic buy or sell signals.
- Pivot levels should be combined with price action or additional technical tools.
- Higher volatility markets can create temporary breaks through pivot levels.
- Always apply proper risk management when trading around support and resistance zones.
- The indicator works best when adapted to the trader’s preferred timeframe and strategy.









