
The Linear Regression Channel indicator for MetaTrader 4 creates a statistical price channel around the recent market trend.
Rather than following price with a single line, it builds a central regression line together with multiple upper and lower boundaries based on price deviation.
This gives you information about both direction and where price currently sits within its recent trading range.
The slope of the regression line is particularly important.
A rising channel points toward bullish momentum, while a declining channel reflects bearish pressure.
The outer boundaries can then be used to judge stretched conditions, potential reversals and areas where price may encounter resistance or support.
For active forex trading, the combination of trend direction and channel position can be especially useful.
A pullback toward the middle of the channel can offer continuation opportunities, while a move toward an outer deviation line may signal that price has reached an area where caution is warranted.
Why traders use the Linear Regression Channel Indicator
The channel gives a quantitative framework for evaluating the direction and intensity of a move.
Instead of judging a trend purely from consecutive candles, the slope provides a broader reading of whether price is progressing upward, downward or moving with limited directional pressure.
The deviation bands add another dimension.
Level 1 can provide an intermediate boundary, while Level 2 represents a more extended distance from the regression line.
When price reaches an outer band after a strong movement, it can become an area to watch for exhaustion or a retracement.
The tool can therefore serve two different approaches: trend continuation when price respects the channel and mean-reversion trading when price becomes stretched toward an extreme boundary.
Price action should determine which interpretation is appropriate for the current market.
Download This MT4 Indicator for Free
Indicator Chart Setup
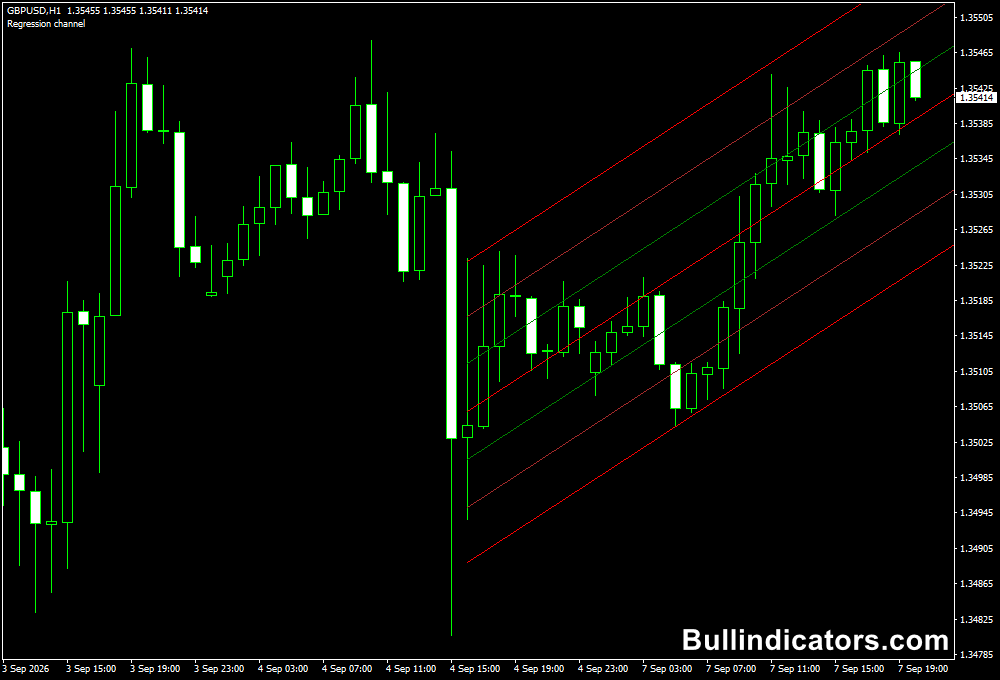
The GBPUSD H1 setup illustrates the channel around the current price path.
The red centerline represents the regression line, with brown Level 1 boundaries and green inner channel lines surrounding it.
The wider Level 2 boundaries identify areas where price has moved significantly away from its statistical center.
When the channel slopes upward, pullbacks toward the lower sections can be monitored for bullish continuation.
In a declining channel, rallies into the upper sections may provide opportunities to look for bearish reactions.
A flat channel requires more caution because price can rotate repeatedly between the boundaries.
Core Features
- Automatic linear regression channel calculation.
- Central regression line showing directional bias.
- Multiple deviation boundaries for different market conditions.
- Useful reference points for dynamic support and resistance.
- Adjustable regression period and deviation values.
- Applicable to both short-term and higher-timeframe charts.
Best for
- Determining whether price is trending or rotating within a range.
- Finding pullback areas during directional moves.
- Identifying statistically extended price conditions.
- Planning entries around channel boundaries.
- Defining potential profit-taking zones.
Best Markets
- GBPUSD for fast intraday channel reactions.
- EURUSD when cleaner directional movement is preferred.
- USDJPY for structured trend and pullback analysis.
- Gold (XAUUSD) during strong directional sessions, provided the channel period is adapted to volatility.
- Major indices such as GER40 and NAS100 for markets with pronounced intraday swings.
Trading Styles
- Intraday trend-following on M15 and H1.
- Short-term reversal setups around outer deviation bands.
- Scalping when the channel is stable and price respects its boundaries.
- Swing analysis on H4 and Daily charts.
- Breakout monitoring when price pushes decisively beyond an established channel.
How traders use it
The most important decision is whether the channel should be treated as a trend framework or a range framework.
A steep slope combined with repeated reactions from one side of the channel generally favors continuation trades.
When the regression line is relatively flat and price travels repeatedly from one boundary toward the other, mean-reversion techniques become more relevant.
For a volatile market, entering directly at an outer band can be risky because strong momentum can keep price outside the expected range.
Waiting for a rejection candle or a confirmed return inside the channel can provide a more disciplined entry.
GBPUSD M5 Volatile Market Example
- Market condition: GBPUSD is experiencing elevated M5 volatility during the London session, with a clear upward regression slope.
- Initial setup: Price accelerates toward the upper Level 2 channel after several strong bullish candles.
- Do not chase: The price is already extended from the regression center, so buying directly into the outer boundary carries poor immediate risk control.
- Entry trigger: Wait for a rejection from the upper Level 2 area followed by a pullback toward the Level 1 or central regression area.
- Hypothetical short entry: GBPUSD reaches 1.3618, rejects the upper channel and then trades back below 1.3608. A short entry around 1.3605 can be considered after bearish confirmation.
- Stop loss: Place the stop around 1.3622, above the recent volatility spike and channel rejection high.
- First target: 1.3590 near the Level 1 area.
- Final target: 1.3575 around the regression center or lower channel area, depending on momentum.
- Trade management: Once price reaches the first objective, partial profits can be taken and the stop reduced if market structure supports it.
Tip
A bullish continuation setup can be approached differently.
When the M5 channel is rising and price pulls back toward the central regression line without breaking the broader structure, a bullish rejection can offer a long entry.
The stop can sit below the recent swing low, with the upper channel boundaries serving as potential targets.
Get Instant Free Access
Indicator Settings
- RPeriod: Determines the regression period used for the channel calculation.
- MidColor: Sets the color of the central regression line.
- LineWeight: Controls the thickness of the channel lines.
- PriceVal: Selects the price type used for the regression calculation.
- StDevOutside2: Sets the deviation value used for the outer Level 2 boundaries.
- Outside2: Controls the color of the Level 2 channel lines.
- StDevOutside: Defines the deviation used for the Level 1 boundaries.
- Outside: Sets the color of the Level 1 lines.
- StDevInside: Controls the deviation used for the inner channel boundaries.
- Inside: Sets the color of the inner lines.
Important Notes
- An outer channel touch does not automatically mean that a reversal will occur.
- Strong breakouts can push price beyond Level 2 for extended periods.
- The channel is most informative when its slope and price location are considered together.
- Short regression periods react quickly but can produce unstable channels during sharp price swings.
- Longer periods provide a broader trend perspective but respond more slowly to market changes.
- Use price action and market structure to confirm reversal entries around the outer boundaries.









