
The Forex Trend Scanner indicator for MetaTrader 4 provides a quick way to assess the current market direction by changing the color of price candles according to trend strength and potential reversals.
Rather than relying on a conventional line or oscillator, the tool modifies the chart itself so that developing momentum can be recognized directly from the candles.
Four colors are used to separate established bullish and bearish conditions from periods where that momentum is beginning to weaken.
This makes the Forex Trend Scanner particularly useful when you want to determine whether an existing move is still healthy, whether a correction may be developing, or whether a potential reversal deserves attention.
Why traders use the Forex Trend Scanner
One of the practical advantages is speed.
A quick look at the candle colors can provide an initial directional bias without requiring several calculations to be interpreted separately.
Lime green represents established bullish momentum, while red represents a sustained bearish phase.
The two darker shades add another layer of information.
Dark green suggests that a bullish move is losing strength, while maroon indicates weakening bearish pressure.
These transitional colors can be useful for trade management, especially when deciding whether to reduce exposure or wait for a new directional signal.
The tool can also be adapted to different trading horizons.
A lower timeframe can be used for short-term entries, while a higher timeframe can provide the broader directional context before a position is opened.
Download This MT4 Indicator for Free
Indicator Chart Setup
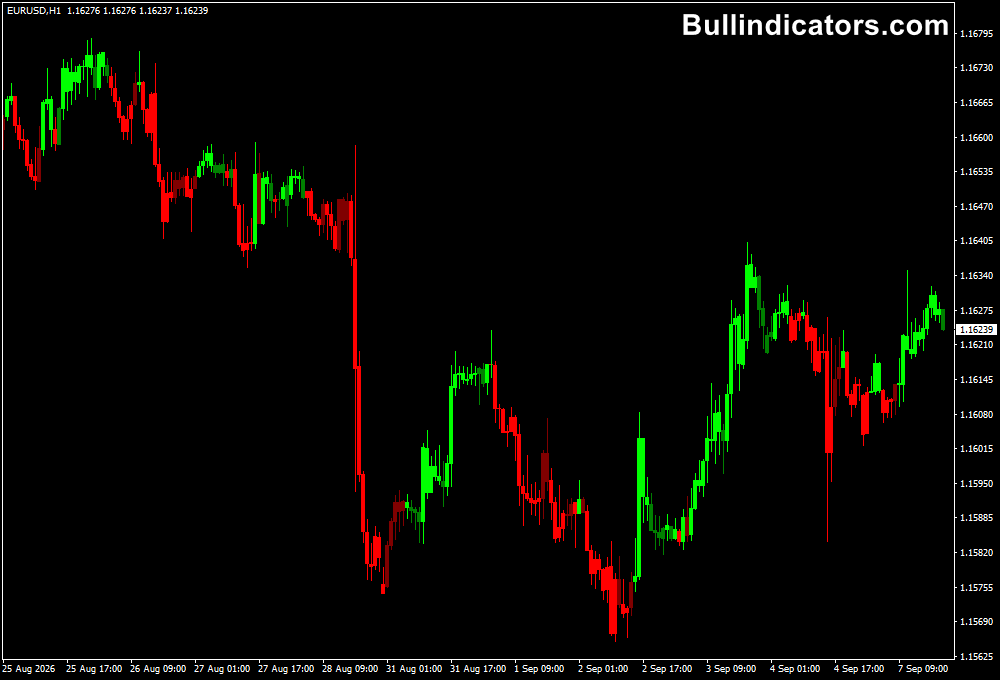
The chart remains price-focused, but the candle colors change according to the calculated market condition.
Lime green candles identify a bullish trend, dark green candles signal weakening bullish momentum, red candles show bearish conditions and maroon candles indicate that selling pressure is beginning to fade.
This color progression can help track a complete market cycle.
For example on the EURUSD H1 chart below, a sequence of red candles may gradually turn maroon before lime green candles appear, highlighting a possible transition from bearish momentum to bullish momentum.
Core Features
- Four-color candle system for directional market analysis.
- Lime green candles indicate established bullish momentum.
- Dark green candles indicate weakening bullish conditions.
- Red candles represent bearish momentum.
- Maroon candles highlight weakening bearish pressure.
- Adjustable sensitivity for earlier or later trend-change signals.
Best for
- Identifying the current directional bias quickly.
- Spotting early signs of trend exhaustion.
- Managing open positions as momentum changes.
- Finding potential reversal phases after extended moves.
- Filtering entries so trades are taken in the direction of stronger momentum.
Best Markets
- EURUSD for liquid intraday trend setups.
- GBPUSD when active London and New York sessions create sustained directional moves.
- USDJPY for structured trend-following on M15 and H1.
- GBPJPY when larger momentum swings provide more pronounced color transitions.
- Gold (XAUUSD) for traders comfortable with higher volatility and wider price ranges.
Trading Styles
- Scalping on M1 and M5 using the latest color transition as a directional filter.
- Day trading on M15 and H1.
- Swing trading with higher-timeframe trend confirmation.
- Trend continuation setups after temporary momentum weakness.
- Trade management using dark green or maroon candles as warning signals.
How traders use it
The four-color system works best when the colors are interpreted as stages rather than isolated signals.
An established trend provides the directional bias, while the darker shade warns that momentum is weakening.
The appearance of the opposite strong color can then confirm that market control may have shifted.
Bullish Setup
- Look for an established bearish sequence with red candles, preferably after a sustained decline.
- When red candles begin changing to maroon, monitor the market for evidence that selling pressure is fading.
- Wait for a new lime green candle to appear and close before considering a long position.
- Place the stop loss below the most recent local low rather than immediately beneath the signal candle.
- Use a fixed risk-to-reward objective such as 1:1.5 or 1:2, or manage the position while lime green candles continue.
- Dark green candles can be treated as a warning that the bullish move is losing momentum.
Bearish Setup
- Start with a sustained bullish phase represented by lime green candles.
- Watch for a sequence changing to dark green, indicating that upward momentum is weakening.
- A fresh red candle closing after the weakening phase can provide the bearish trigger.
- Place the stop loss above the most recent swing high.
- Profit can be taken at a predefined risk multiple or managed while the candles remain red.
- Maroon candles can act as an early warning that bearish momentum is beginning to deteriorate.
The sensitivity setting deserves particular attention.
A higher sensitivity value can identify reversals earlier, which may benefit short-term strategies, but the increased responsiveness can also create more noise.
Lower sensitivity can produce more selective transitions and may be preferable when the goal is to filter minor price fluctuations.
Get Instant Free Access
Indicator Settings
- Sensitivity: Controls how quickly the tool reacts to changes in price momentum and potential trend reversals.
- A higher value can generate earlier reversal indications but may also increase the number of weaker transitions.
- A lower value generally produces slower changes and can help filter some short-term market noise.
Important Notes
- The candle colors describe momentum conditions but should not be treated as guaranteed entry signals.
- Short-term charts can produce frequent color changes, particularly during sideways markets.
- Price structure and nearby support or resistance should be considered before opening a position.
- The darker colors are valuable as warnings, but weakening momentum does not always lead to an immediate reversal.
- Test the sensitivity setting on each market and timeframe because volatility differs considerably between instruments.
- Combining the scanner with a separate entry or confirmation method can improve trade selection and risk control.









