
The Last High Low Stop Loss indicator for MetaTrader 4 is designed specifically around one of the most important parts of any trading plan: where to place the stop loss.
Rather than using an arbitrary number of pips, the tool calculates potential stop levels from recent swing points generated through the ZigZag calculation.
The result is an upper and lower reference level around current price.
The lower level is particularly useful for long positions, while the upper level provides a reference for short positions.
The chart can also show the calculated price and its distance from the current market, making it easier to evaluate risk before opening a trade.
Because the levels follow newly established swing points, the same tool can also be used for trailing an open position.
The approach works across intraday charts and higher timeframes, making it useful for both short-term risk management and broader swing analysis.
Why traders use the Last High Low Stop Loss Indicator
Good stop placement needs to account for normal price movement.
A stop positioned too close to the entry can be removed by an ordinary market fluctuation, while a stop that is excessively wide can create an unnecessarily large risk per trade.
This tool provides a market-based alternative by referencing recent highs and lows.
The upper and lower levels can be compared with nearby support, resistance, trendlines or channels before the final stop is selected.
This gives the risk decision a direct connection to the current price structure.
Another advantage is the ability to use the higher timeframe as a guide.
A swing low on H1 or H4, for example, can help confirm whether a stop calculated on M5 is positioned in a sensible location.
Download This MT4 Indicator for Free
Indicator Chart Setup
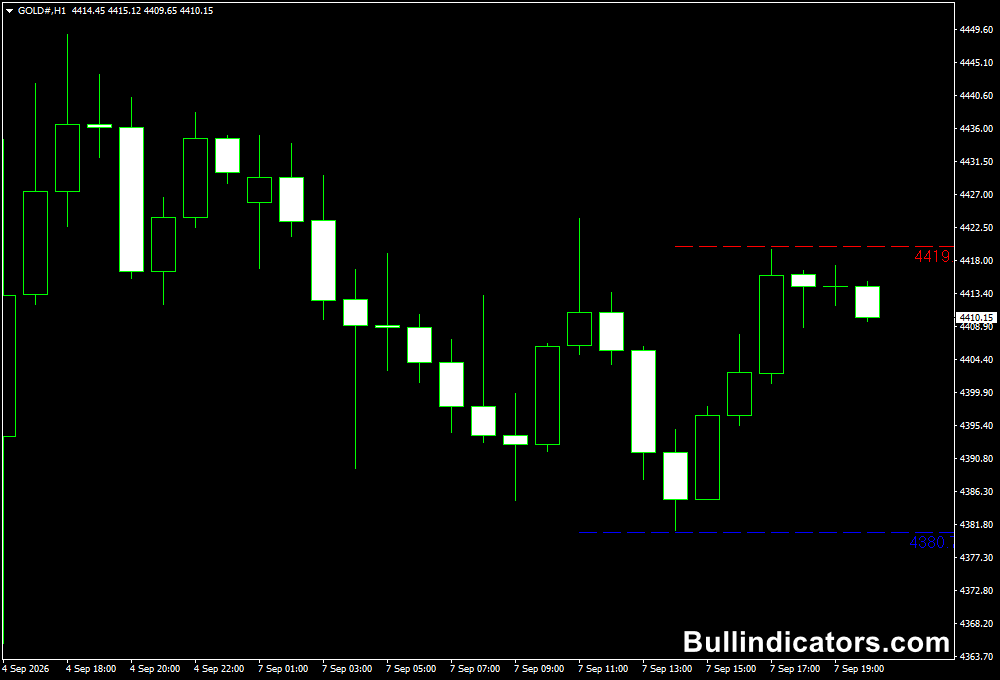
The Gold H1 example shows two dotted reference levels surrounding price.
The upper stop level appears in red, while the lower stop level is displayed in blue.
The indicator also provides the corresponding stop price and the distance between that level and the current market.
For a long position, the blue lower level identifies the area below the latest relevant swing low.
For a short position, the red upper level marks the corresponding area above a recent swing high.
These levels can be especially useful when determining whether a setup offers enough room for a realistic risk-to-reward ratio.
Core Features
- Automatic upper and lower stop-loss reference levels.
- Based on ZigZag swing calculations.
- Displays the distance between price and the calculated stop.
- Useful for both initial stop placement and trade management.
- Can be applied to multiple MT4 timeframes.
- Higher-timeframe swing levels can support lower-timeframe risk decisions.
Best for
- Setting stops around recent swing highs and lows.
- Calculating risk before entering a position.
- Trailing positions during directional markets.
- Checking whether a setup provides sufficient reward potential.
- Combining technical stop levels with support and resistance analysis.
Best Markets
- EURUSD for tight-spread scalping and intraday setups.
- GBPUSD for M15 to H1 directional trades.
- EURJPY when wider swings are useful for risk placement.
- Gold (XAUUSD) when volatility requires stops based on actual market structure.
- NAS100 and US30 for traders needing stops that adapt to expanding price ranges.
Trading Styles
- Scalping with structure-based stops on M1 and M5.
- Day trading on M15, M30 and H1 charts.
- Swing trading using H4 or Daily swing points.
- Trend-following with a dynamic trailing stop.
- Multi-timeframe setups where the higher chart validates the lower-timeframe stop.
How traders use it
The indicator is primarily a risk-management tool, so the trading signal should normally come from a separate strategy.
Once a valid entry appears, the upper and lower levels can be evaluated to determine which swing point provides the most logical invalidation level.
For scalpers, the tool becomes particularly useful when paired with a fast entry system.
Scalping example
The Ultimate PRO Scalper Indicator for MT4, for example, can provide the entry direction on an M5 EURUSD chart, while the Last High Low Stop Loss Indicator helps define where the trade should be abandoned if price moves against the setup.
EURUSD M5 Bullish Scalp Setup
- Use the Ultimate PRO Scalper Indicator for MT4 to identify a green buy arrow on EURUSD M5.
- Do not enter simply because the green arrow appears. Check whether price is trading in a favorable short-term environment and whether the recent swing structure leaves enough room for a worthwhile target.
- After a green buy arrow, locate the blue lower stop-loss line from the Last High Low Stop Loss Indicator.
- This blue level represents the structure-based downside reference. It should normally sit below the recent swing low, giving the position room to absorb ordinary fluctuations.
- Illustrative example: EURUSD produces a green buy arrow at 1.1650, while the lower stop level is at 1.1638.
- Initial stop loss: 1.1638, creating approximately 12 pips of risk.
- A target around 1.1674 would provide roughly 24 pips of potential reward, producing a 1:2 risk-to-reward profile.
- If price advances strongly, the stop can be reviewed as new swing lows develop. A rising lower level can then be used to protect part of the open profit.
EURUSD M5 Bearish Scalp Setup
- Wait for the Ultimate PRO Scalper Indicator for MT4 to produce a red arrow, indicating the opposite scalp direction.
- Confirm that price is not immediately approaching a strong support area that could interrupt the short trade.
- Use the red upper stop-loss level from the Last High Low Stop Loss Indicator as the primary structural reference.
- The level should remain above the latest meaningful swing high, allowing the trade some room if price makes a minor retracement.
- Illustrative example: EURUSD gives a red sell arrow at 1.1662 while the upper stop level sits at 1.1675.
- Initial stop loss: 1.1675, representing approximately 13 pips of risk.
- A downside target at 1.1636 would offer about 26 pips of potential reward, again creating a 1:2 risk-to-reward ratio.
- As bearish price structure develops, monitor the upper level for a declining stop reference that can help lock in gains during the move.
Get Instant Free Access
Indicator Settings
- ExtDepth: Sets the depth used by the ZigZag calculation to identify significant market swings.
- ExtDeviation: Determines the deviation required for a new ZigZag swing to qualify.
- ExtBackstep: Controls the minimum separation between ZigZag swing points.
- MinimumStopLoss: Defines the minimum acceptable distance for the calculated stop.
- BackLookBars: Specifies how many historical bars are examined when calculating the relevant levels.
Important Notes
- The levels are derived from ZigZag calculations, so the latest swing can change as new price information develops.
- A structural stop is not automatically the correct stop for every strategy; volatility and the trade thesis still matter.
- Avoid placing the stop exactly on an obvious swing if the instrument regularly probes those levels.
- Compare the calculated stop with higher-timeframe support or resistance before committing capital.
- The tool works best as a risk-management component alongside a separate entry method.
- Position size should be reduced when the required structural stop becomes wider than the strategy normally allows.









