
The Market Profile indicator for MT5 is an advanced market analysis tool that displays the price areas where the highest trading activity occurs.
By analyzing the distribution of price movement, the indicator highlights important zones that can act as potential support, resistance, entry areas, and reversal points.
Market Profile analysis is widely used by professional traders because it provides a different perspective compared with traditional indicators.
Instead of only following price direction, it shows where the market has accepted or rejected certain price levels.
The indicator automatically creates market profile histograms and identifies important trading areas, making it easier to understand market structure and plan potential buy and sell opportunities.
Why Traders Use the Market Profile Indicator
Price does not move randomly.
Markets often spend more time around certain levels where buyers and sellers are actively participating.
The Market Profile Indicator helps locate these high-interest areas and provides valuable information about possible future price reactions.
The indicator is useful for identifying support and resistance zones without manually drawing multiple levels on the chart.
The histogram shows areas with increased market activity, while the median area can act as an important reference point for trading decisions.
Many traders use Market Profile together with other technical tools.
For example, a buy signal from the indicator becomes stronger when confirmed by a trend indicator, moving average, or price action pattern.
Combining multiple confirmations can increase the probability of selecting profitable trades compared with relying on a single signal.
Download This MT5 Indicator for Free
Indicator Chart Setup
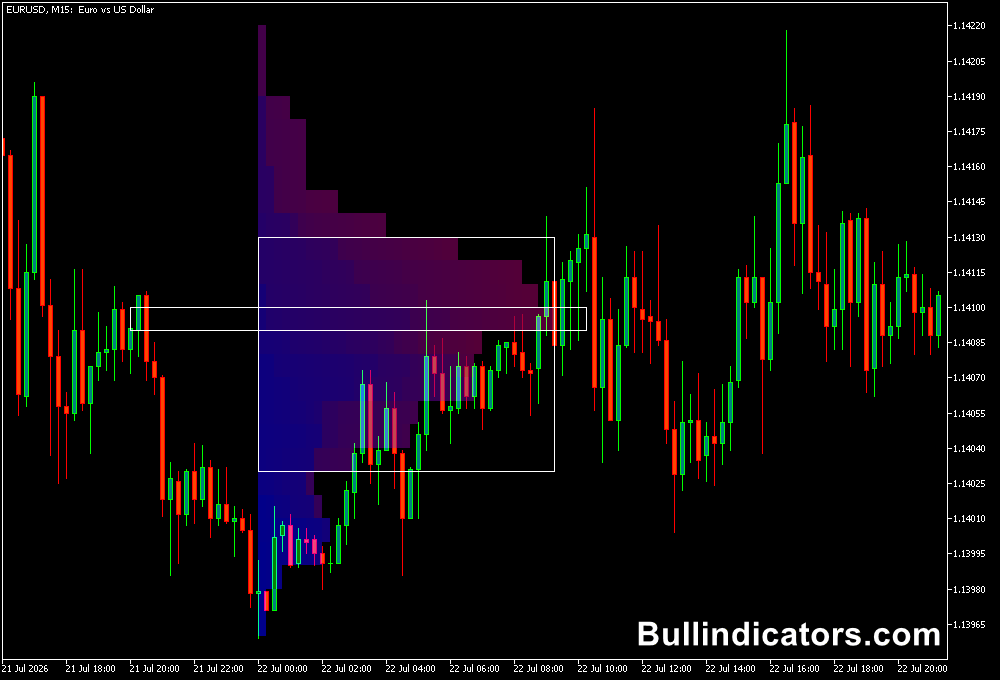
After applying the Market Profile Indicator to a MetaTrader 5 chart, a histogram appears showing the distribution of trading activity across different price levels.
The profile is displayed as a blue histogram, while the median area is highlighted in white.
The indicator organizes each trading session into a market profile block.
It can be used on intraday charts as well as daily, weekly, and monthly analysis. The profile helps identify where price has previously found acceptance or rejection.
Core Features
- Displays market activity distribution by price levels.
- Highlights important support and resistance zones.
- Shows market profile histogram areas.
- Identifies potential reversal zones.
- Works with multiple trading sessions.
- Suitable for intraday and higher timeframe analysis.
Best for
- Market structure analysis.
- Support and resistance trading.
- Trend continuation setups.
- Reversal zone identification.
- Breakout strategies.
- Institutional-style price analysis.
Best Markets
- EUR/USD, GBP/USD, USD/JPY, and GBP/JPY.
- Gold (XAU/USD).
- NASDAQ 100 and S&P 500.
- Crude Oil.
- Bitcoin and cryptocurrency markets.
- Major stock indices.
Trading Styles
- Intraday trading on M15 and M30 charts.
- Day trading on H1 charts.
- Swing trading using Daily profiles.
- Breakout trading around key levels.
- Reversal trading from market acceptance zones.
- Multi-timeframe market analysis.
How Traders Use It
The main concept behind trading with Market Profile is identifying important price acceptance areas.
The highest histogram zones often represent areas where strong market participation occurred and can become important reference points.
For example, if price moves above the previous session’s median area and holds above it, traders may look for buying opportunities.
A stop loss can be placed below a recent swing low or another technical support level.
For bearish setups, traders can monitor when price breaks below the median zone and fails to recover.
A short position may be considered with a stop above the latest swing high.
To improve trade accuracy, Market Profile signals should be confirmed with other indicators.
For example, combining the indicator with a trend indicator can help determine whether a breakout or reversal has a higher probability of success.
A bullish Market Profile signal combined with a positive trend filter and strong price action creates a stronger trading setup.
Get Instant Free Access
Indicator Settings
- Session: Selects the calculation period, including Intraday, Daily, or Weekly sessions.
- StartFromDate: Defines the starting date used for market profile calculations.
- StartFromCurrentSession: When enabled, the indicator automatically calculates from the latest trading session.
- SessionToCount: Sets the number of previous sessions included in the calculation.
Important Notes
- Market Profile is designed to support analysis and should not be traded as a standalone system.
- Confirm buy and sell signals with additional indicators or price action confirmation.
- Previous session median levels can act as important support and resistance areas.
- Higher timeframe profiles often provide stronger market information.
- Different markets may require different session settings.
- Always use proper risk management when trading market profile setups.









