
The Moving Average indicator for MetaTrader 4 is a versatile trend-following tool that smooths short-term price fluctuations and provides a reference for the prevailing market direction.
By comparing current price with its moving average level, you can quickly assess whether buyers or sellers have greater control.
This version offers adjustable calculation parameters, allowing the same tool to be adapted to different instruments, timeframes and trading approaches.
It can be used for trend identification, pullback entries, dynamic support and resistance, and as the foundation of a two-moving-average crossover system.
Its simplicity makes it practical for both short-term and longer-term analysis.
On a fast chart, the line can help identify immediate momentum, while a longer setting can provide a broader trend filter and reduce the impact of minor price fluctuations.
Why traders use the Moving Average Indicator
One of the main strengths of a moving average is its ability to reduce market noise.
Rather than reacting to every individual candle, the calculation produces a smoother representation of price, making it easier to recognize whether the market is generally advancing or declining.
The line can also become a dynamic area of support or resistance.
During a strong trend, price may repeatedly pull back toward the average before continuing in the prevailing direction.
This creates a practical framework for waiting for better-priced entries rather than entering after an extended move.
The customizable calculation method is another advantage.
Simple, exponential, weighted and linear-weighted approaches can be selected, making the tool suitable for a wide range of trading systems.
Download This MT4 Indicator for Free
Indicator Chart Setup
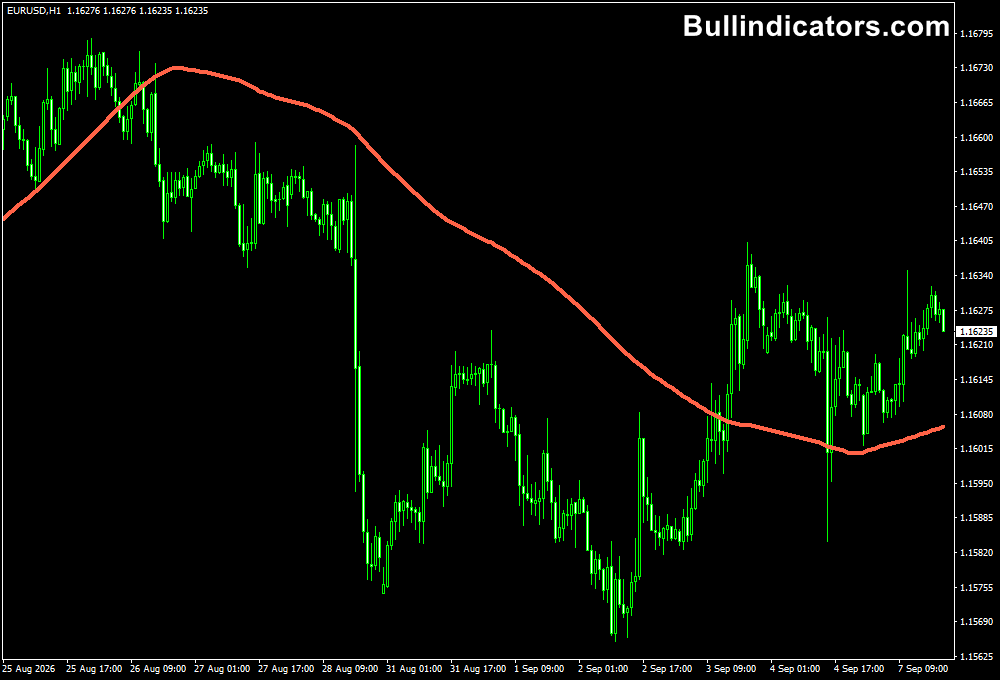
The EURUSD H1 chart presents a moving average directly alongside price, creating a reference line that changes with the market.
When candles consistently trade above the line and the average slopes upward, bullish conditions are generally favored.
Persistent trading below a declining average points toward bearish pressure.
The line becomes particularly useful during pullbacks.
In a rising market, a return toward the average can provide an area to monitor for renewed buying.
During a decline, an upward retracement into the line can offer a location to look for selling pressure.
Core Features
- Adjustable moving average calculation period.
- Customizable price shift for positioning the average.
- Choice of calculation methods including SMA, EMA, WMA and LWMA.
- Useful dynamic support and resistance reference.
- Suitable for multiple instruments and MT4 timeframes.
- Can form the basis of single-line or crossover strategies.
Best for
- Filtering market noise and identifying directional bias.
- Finding pullback areas during established trends.
- Defining dynamic support and resistance.
- Building fast-versus-slow moving average crossover systems.
- Confirming directional conditions before taking lower-timeframe entries.
Best Markets
- GBPJPY for fast-moving intraday and swing opportunities.
- EURUSD for smoother trend-following setups.
- USDJPY for pullback and crossover strategies.
- Gold (XAUUSD) when a stronger trend filter is needed on volatile sessions.
- Major indices such as NAS100 and US30 for directional momentum trades.
Trading Styles
- Scalping with shorter averages on M1, M5 and M15.
- Day trading using M15, M30 and H1 trend conditions.
- Swing trading with longer averages on H4 and Daily charts.
- Trend continuation based on moving-average pullbacks.
- Crossover systems using a short and long average together.
How traders use it
The most effective way to use a moving average is often to combine a shorter MA with a longer MA.
The fast average reacts to recent price movement, while the slower average defines the broader directional bias.
Their relationship can filter many signals that would be difficult to interpret with a single line.
Bullish GBPJPY H1 Setup
- Use a shorter 20-period MA together with a longer 50-period MA on the GBPJPY H1 chart.
- Wait for the 20 MA to cross above the 50 MA, showing that short-term momentum has moved above the broader trend.
- Do not chase the initial crossover if price has already moved sharply higher.
- Wait for GBPJPY to retrace toward the moving averages while the 20 MA remains above the 50 MA.
- Look for bullish price action around the MA area before entering long.
- Illustrative entry: 198.20 after a bullish rejection from the moving averages.
- Stop loss: 197.55 below the recent swing low and support area.
- Target: 199.50, giving the position room to capture a continuation of the H1 trend.
Bearish GBPJPY H1 Setup
- Keep the same 20-period and 50-period MA combination on GBPJPY H1.
- Look for the 20 MA to cross below the 50 MA, establishing a bearish directional bias.
- Allow price to retrace toward the averages rather than selling after an extended decline.
- A bearish rejection from the moving-average zone can provide the entry trigger.
- Illustrative entry: 197.80 following a failed recovery into the MA area.
- Stop loss: 198.45 above the latest swing high.
- Target: 196.40 near a previous demand area and potential support zone.
- The setup becomes stronger when the crossover agrees with the higher-timeframe trend.
Get Instant Free Access
Indicator Settings
- MA_Period: Sets the number of bars used to calculate the moving average.
- MA_Shift: Moves the average forward or backward relative to the current price.
- MA_Method: Selects the calculation type, including Simple, Exponential, Smoothed, Weighted and other available methods depending on the version.
Important Notes
- A single moving average can react late when the market reverses sharply.
- Sideways conditions can produce repeated crossovers with limited follow-through.
- A longer MA generally provides a slower but broader market reading.
- A shorter MA is more responsive but may generate more false signals.
- Combining two averages with price action can provide stronger confirmation than relying on one crossover alone.
- Stop-loss placement should account for current volatility and recent swing structure.









