
The Elliott Fibonacci indicator for MetaTrader 4 combines two widely used forms of technical analysis: Elliott Wave analysis and Fibonacci ratios.
It automatically maps the developing Elliott wave structure on the chart and applies Fibonacci levels to the current wave, giving you a practical framework for studying retracements and projected price targets.
The combination is particularly useful because Elliott Wave analysis provides the directional and structural context.
At the same time, Fibonacci levels help determine where a corrective move may end or where the next impulse could extend.
The indicator can therefore be used to locate potential entries, stop-loss areas and multiple profit objectives without manually drawing every wave and Fibonacci level.
Why traders use the Elliott Fibonacci Indicator
Elliott Wave analysis can become complicated when wave counts and retracement levels have to be drawn manually.
This tool automates much of that chart work by calculating previous price movement and presenting the resulting wave structure together with Fibonacci ratios.
The green wave lines help distinguish the prevailing directional movement, while the Fibonacci levels provide price zones to watch during retracements.
Multiple target levels can also be displayed, which is useful when a developing impulse has room to continue beyond the first projected objective.
Download This MT4 Indicator for Free
Indicator Chart Setup
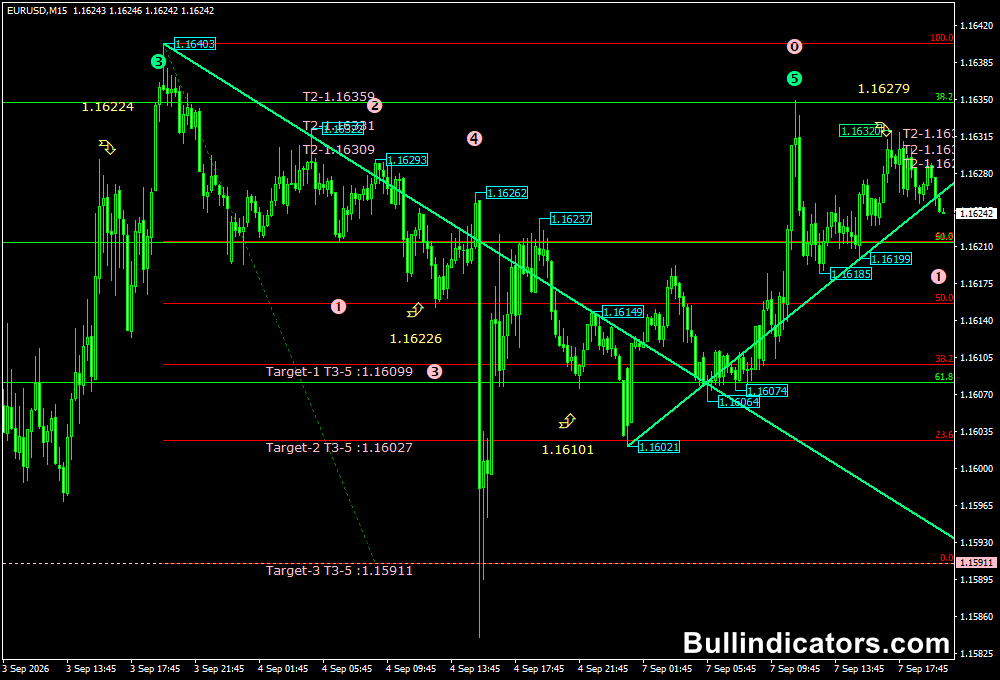
The EURUSD M15 example shows the Elliott Fibonacci Indicator plotting the wave structure with green trend lines.
Fibonacci levels are drawn across the active wave, with upper levels shown in green and lower levels in red.
These levels provide reference points for retracements, potential support and resistance, as well as projected exits.
The changing relationship between price and the wave structure is important.
A bullish wave sequence combined with a retracement into a key Fibonacci area can create a potential long setup.
In contrast, a bearish sequence followed by an upward correction may offer a short opportunity when price reaches a suitable retracement zone.
Core Features
- Automatic Elliott Wave calculation based on historical price movement.
- Fibonacci retracement levels applied to the active wave.
- Projected target levels for potential profit-taking.
- Trend lines showing the broader wave direction.
- Intermediate trend lines for additional market detail.
- Adjustable calculation depth and wave-drawing parameters.
Best for
- Studying impulse and corrective wave sequences.
- Finding retracement areas within an established directional move.
- Planning entries around Fibonacci support and resistance.
- Projecting multiple profit targets from the current wave.
- Combining Elliott Wave analysis with trend-following methods.
Best Markets
- EURUSD for structured H1 and H4 swing movements.
- GBPJPY where extended directional waves can produce deeper retracements.
- USDJPY for medium-term Fibonacci and wave analysis.
- Gold (XAUUSD) for larger impulse moves and significant corrective phases.
- US indices such as NAS100 when strong directional swings are present.
Trading Styles
- Swing trading using H1, H4 and Daily wave structures.
- Position-style analysis based on larger Elliott sequences.
- Trend continuation entries following Fibonacci retracements.
- Reversal setups near projected wave completion areas.
- Multi-timeframe analysis where higher-timeframe waves guide lower-timeframe entries.
How traders use it
A practical method is to begin with the wave direction and then wait for price to retrace into one of the displayed Fibonacci levels.
The objective is not simply to buy or sell at every ratio.
The stronger setups occur when the wave structure, trend direction and Fibonacci level all support the same scenario.
For example, during a bullish sequence, a corrective decline toward a Fibonacci retracement can provide an area to search for a long entry.
During a bearish sequence, an upward correction toward a Fibonacci level can create a potential short setup.
The projected target levels can then be used to scale out or define a final exit.
- EURUSD bullish setup: On the H1 chart, identify a rising Elliott wave structure and wait for a correction toward a lower Fibonacci retracement. A bullish reaction from that zone can provide the entry, with the stop below the recent corrective swing.
- Gold bearish setup: On XAUUSD H1, look for a completed upward correction within a broader bearish wave. A rejection near a Fibonacci retracement level can trigger a short position, with the stop above the corrective high.
- GBPJPY continuation: During a strong H4 bullish wave, a retracement into a Fibonacci support area can offer a second-entry opportunity rather than chasing the initial move.
- Profit planning: The displayed target levels can be used for partial exits, while the final position can remain open if momentum continues toward a higher projection.
Get Instant Free Access
Indicator Settings
- History: Controls the number of previous bars considered during Elliott Wave calculations.
- Begin_draw_down: Defines the starting conditions for downward wave calculations.
- Begin_draw_up: Defines the starting conditions for upward wave calculations.
- sektor_bar: Adjusts the bar range used during wave identification.
- f_period_draw: Controls the calculation period used for drawing the wave structure.
- clear_opposite: Manages how opposing wave information is handled on the chart.
- Wave_bar: Adjusts the bar parameters used for wave plotting.
- f_draw_wawe_fibo: Enables the Fibonacci levels associated with the identified wave.
- f_draw_target_level: Displays projected Fibonacci target levels.
- DM_sdvig / DM_xvost: Adjust the upper and lower trend-line positioning.
- F_draw_mini_trend: Displays intermediate trend lines within the larger structure.
Important Notes
- Elliott Wave interpretation remains subjective, even when the calculation and drawing are automated.
- Fibonacci levels should be treated as potential reaction zones rather than guaranteed turning points.
- The strongest setups generally combine wave direction with price action confirmation.
- Higher timeframes can provide more meaningful wave structures, while lower charts may produce more frequent changes.
- Use predefined risk limits because a wave count can change as new price information develops.
- Test the settings on the selected market and timeframe before applying the strategy to live trading.









