
The Support Demand indicator for MT4 is built around one of the oldest ideas in market analysis: price tends to react when buying or selling pressure becomes concentrated around a particular area.
It marks supply and demand zones directly on the chart.
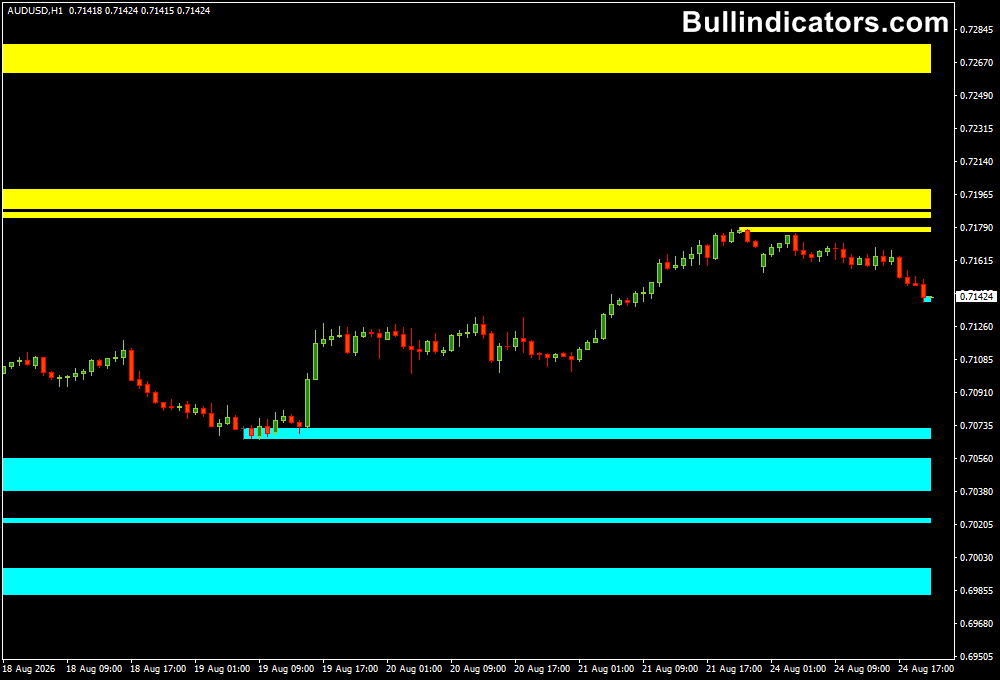
Blue areas represent demand, where previous buying pressure pushed price higher, while yellow areas represent supply, where selling pressure caused a downward move.
This makes the tool particularly useful for traders who want to plan entries around price levels rather than chase a move after it has already started.
It can be used on any timeframe, making it suitable for quick intraday setups as well as higher-timeframe analysis.
Why traders use the Support Demand Indicator
The main advantage is that important areas are marked automatically from previous price behavior.
When price returns to one of these zones, traders can watch how the market reacts and decide whether the area is likely to hold or break.
The zones can also be used as part of a larger trading system.
For example, during an uptrend, a trader can focus on demand zones for potential long entries.
During a downtrend, supply zones can provide areas to look for short setups.
The indicator can also remove zones when price breaks through them, helping keep the chart focused on currently relevant levels.
Download This MT4 Indicator for Free
Indicator Chart Setup
Once displayed on a MetaTrader 4 chart, the Support Demand Indicator draws colored zones around areas where significant price reversals have occurred.
Blue zones identify demand and can act as potential support. Yellow zones identify supply and can act as potential resistance.
When price returns to a zone, the reaction becomes the key point to watch.
A strong rejection can support a reversal setup, while a decisive break can signal that the zone has lost its usefulness.
The zones are removed automatically when price breaks through them.
Core Features
- Automatically identifies supply and demand areas from price behavior.
- Displays demand zones in blue and supply zones in yellow.
- Can be used on any timeframe from short-term charts to higher timeframes.
- Supports multi-timeframe zone analysis through the Forced TF setting.
- Removes zones when price breaks through them.
- Works well as a standalone level-mapping tool or alongside trend confirmation.
Best for
- Finding potential reversal areas.
- Planning entries around established support and resistance.
- Identifying pullback opportunities within an existing trend.
- Combining supply and demand analysis with momentum or trend tools.
Best Markets
- EURUSD and GBPUSD for liquid intraday setups.
- GBPJPY and EURJPY when larger price swings create wider trading opportunities.
- Gold and major indices where strong directional moves frequently return to previous price areas.
- Other currency pairs and instruments can also be tested across different market conditions.
Trading Styles
- Intraday trading on M5, M15 and H1 charts.
- Scalping around fresh supply and demand zones.
- Swing trading using H4 and daily zones.
- Trend-following pullbacks where price returns to a zone in the direction of the prevailing trend.
How traders use it
The most practical approach is to combine the zones with the current market direction.
During an uptrend, wait for price to retrace toward a blue demand zone and look for bullish price action before considering a long position.
During a downtrend, watch yellow supply zones for bearish rejection and potential short entries.
A useful technique is to add a trend filter so that supply and demand setups are taken in the direction of the broader move.
Example with the Zero Lag MA Indicator
The Zero Lag Moving Average Indicator for MT4 changes between green and orange as its calculated market bias changes.
Green represents bullish conditions, while orange represents bearish conditions.
A simple combination can work like this:
- Wait for the Zero Lag Moving Average to turn green, establishing a bullish market bias.
- Ignore most short setups while the broader bias remains bullish.
- Wait for price to pull back toward a blue demand zone marked by the Support Demand Indicator.
- Watch for bullish rejection, such as a strong bullish candle or a break above the high of the rejection candle.
- Consider the long entry once the price action confirms that buyers are defending the zone.
- Place the stop loss below the demand area or the recent swing low.
- Target a previous high, opposing supply zone, or another logical resistance area.
- When the Zero Lag Moving Average turns orange, reassess long positions because the market bias has changed.
For short trades, reverse the logic: look for an orange Zero Lag Moving Average, wait for price to return to a yellow supply zone, and then look for bearish confirmation.
This combination can help filter weaker countertrend setups and potentially capture larger moves.
Get Instant Free Access
Indicator Settings
- Forced TF: Sets the timeframe in minutes used to calculate the supply and demand zones. Use 0 for the current chart timeframe.
- Use Narrow Bands: Controls whether narrower zones are used.
- Kill retouch: Determines how the calculation handles price entering the range of a previous zone.
- Top color: Sets the color used for the supply zone.
- Bot color: Sets the color used for the demand zone.
- Price Mark: Sets the color of the price mark displayed on the chart.
- Price Width: Controls the size of the price mark.
Important Notes
- A supply or demand zone is not a guarantee that price will reverse.
- A broken zone should not be treated as valid support or resistance.
- Using the tool with a trend filter can reduce the number of countertrend setups.
- For scalping, combine zones with short-term price confirmation rather than entering solely because price touches an area.
- Test the settings and trading approach on a demo account before risking real capital.
Tip
If your goal is to capture more pips rather than every possible reversal, focus on demand zones during bullish conditions and supply zones during bearish conditions.
Let the trend determine the direction and the zone determine where to look for the entry.









