
The Murrey Math indicator for MT4 automatically divides the current trading range into a series of price levels that can be used for support, resistance, trend analysis and trade management.
The most important areas include the pivotal entry level, ultimate support and resistance, reversal levels and the upper and lower limits of the current range.
These levels give you a clear map of where price may react, continue or change direction.
The indicator is suitable for intraday charts as well as higher timeframes, making it useful for scalping, day trading and multi-timeframe analysis.
Why traders use the Murrey Math Indicator
The main benefit is having several important market levels calculated automatically.
Instead of manually searching for potential reaction zones, you can use the Murrey Math structure to assess where price is positioned within its current range.
The pivotal entry line is especially useful for determining directional bias.
Price holding above this level favors bullish conditions, while trading below it supports a bearish outlook.
The ultimate support and resistance levels can then be used to locate potential reversal zones and profit targets.
Download This MT4 Indicator for Free
Indicator Chart Setup
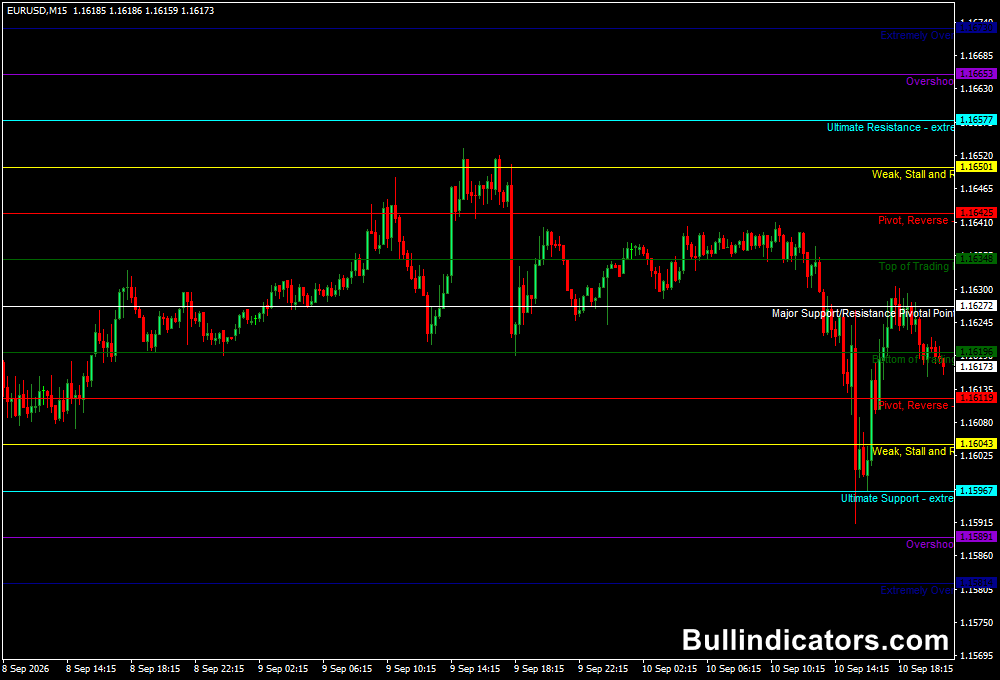
The indicator displays several horizontal levels across the chart.
The white line represents the pivotal entry level, while the aqua lines identify ultimate support and resistance.
Additional colored levels mark major reversal areas, weaker stall zones and the upper and lower boundaries of the trading range.
The layout makes it easy to see whether price is trading in the upper or lower portion of the range and how close it is to an important reaction level.
Core Features
- Automatically calculated support and resistance levels
- Pivotal entry level for bullish and bearish bias
- Ultimate support and resistance zones
- Reversal and stall levels
- Upper and lower trading-range boundaries
- Suitable for multi-timeframe analysis
Best for
- Identifying potential reversal zones
- Finding entry and exit areas
- Defining stop-loss and take-profit locations
- Confirming bullish or bearish market bias
- Mapping price ranges before short-term trades
Best Markets
- EURUSD and GBPUSD for highly liquid intraday setups
- USDJPY and EURJPY for active session trading
- GBPJPY when larger price swings are present
- XAUUSD for level-based momentum and reversal analysis
- Generally suitable for all forex pairs and other MT4 instruments
Trading Styles
- Scalping on M1, M5 and M15
- Intraday trading on M15 and H1
- Range trading around key Murrey levels
- Trend-following breakouts
- Swing trading on H4 and Daily charts
How traders use it
A practical approach starts with the pivotal entry level.
When price is holding above it, focus on bullish setups around support or after a confirmed breakout through resistance.
When price remains below the pivotal level, concentrate on bearish opportunities around resistance or breakdowns.
Bullish and Bearish Setup
- Bullish setup: Price holds above the pivotal level and pulls back toward ultimate support.
- Entry confirmation: Look for bullish price action or a rejection candle at the support area.
- Stop loss: Place the stop below the recent swing low or below the relevant support level.
- Profit target: The next Murrey resistance level can provide a logical target.
- Bearish setup: Price remains below the pivotal level and rallies toward ultimate resistance.
- Entry confirmation: Watch for bearish rejection or a clear failure at the resistance zone.
- Stop loss: Position the stop above the recent swing high or resistance area.
- Profit target: The next lower Murrey support level can be used as a target.
Practical Example: EURUSD H1 Trade
- EURUSD is trading above the pivotal Murrey level, establishing a bullish directional bias.
- Price retraces toward the ultimate support line instead of immediately continuing higher.
- A bullish rejection candle forms at support, providing confirmation for a potential long entry.
- A stop loss is placed below the recent swing low, limiting the risk if support fails.
- The next major Murrey resistance level becomes the initial profit target.
- For example, if the setup risks 10 pips and price reaches a 20-pip target, the trade produces a 2:1 risk-to-reward outcome.
- If price breaks decisively through the resistance, the position can be managed toward the following level rather than closed immediately.
Get Instant Free Access
Indicator Settings
- P: Controls the Murrey Math calculation range. Higher values are generally more suitable for higher timeframes, while lower values produce more detailed levels.
- Stepback: Checks previous closing prices to provide additional confirmation for the calculated levels.
Important Notes
- The pivotal level is useful for determining the primary bullish or bearish bias.
- Ultimate support and resistance can act as important reaction areas.
- A breakout through a major level should be confirmed before treating it as a new trend.
- Higher-timeframe levels can be used to strengthen lower-timeframe entry decisions.
- Always apply appropriate risk management and avoid relying on a single technical signal.









