
The Support Resistance indicator for MT4 is a powerful technical analysis tool designed to automatically identify important support and resistance zones on the trading chart.
These areas represent price levels where buying or selling pressure may appear, making them essential for many trading strategies.
Manually drawing support and resistance levels can take time and often depends on personal interpretation.
This indicator simplifies the process by scanning market data and displaying key zones from multiple timeframes, helping traders quickly recognize important price areas.
Whether analyzing trend reversals, breakouts, or continuation setups, the tool provides a practical way to include support and resistance analysis in a complete trading strategy.
Why traders use the Support Resistance Indicator
Support and resistance levels are among the most widely followed concepts in technical analysis because price often reacts around previous highs, lows, and psychological price areas.
The Support Resistance Indicator helps identify these zones automatically, reducing the need for manual chart preparation.
A major advantage is its multi-timeframe functionality.
The indicator can display important levels from higher timeframes such as H4, Daily, Weekly, and Monthly charts while analyzing a lower timeframe.
This gives a broader market perspective and helps identify areas where price may experience stronger reactions.
The tool is also useful for both beginners and experienced market participants.
New users can learn how important levels are created, while advanced users can save time by allowing the indicator to handle the initial zone detection process.
Download This MT4 Indicator for Free
Indicator Chart Setup
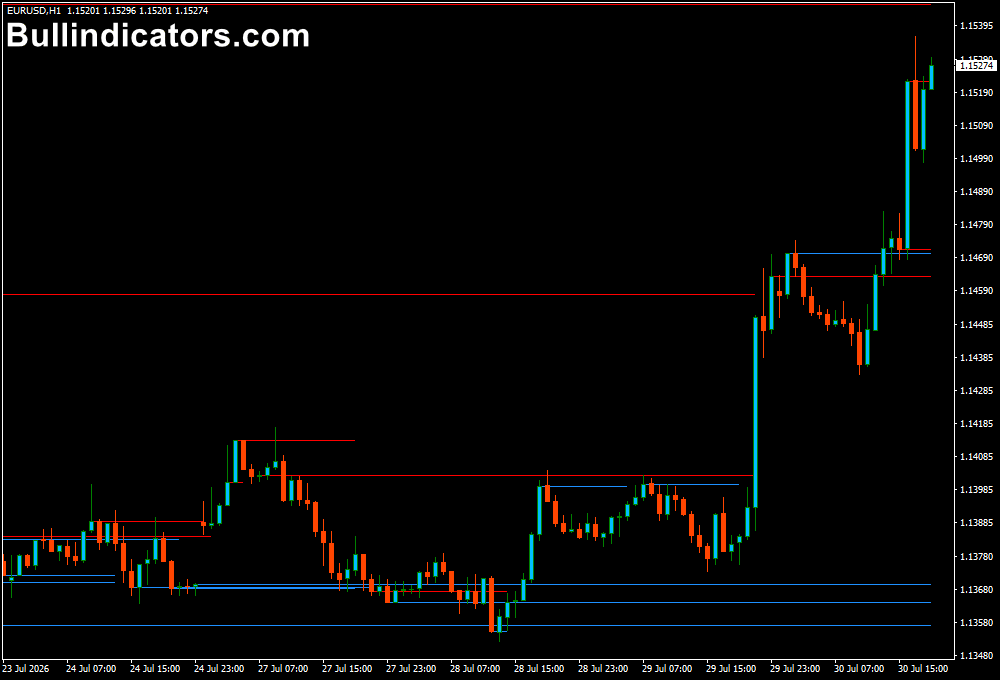
The chart display shows automatically generated support and resistance zones across different timeframes.
Resistance areas are marked with red lines, while support zones are displayed with blue lines.
These levels allow users to monitor possible bounce areas, breakout points, and locations where price momentum may slow down.
For example, a resistance level from the Daily timeframe appearing on an H1 chart may represent a stronger barrier than a level created only from short-term price movement.
Core Features
- Automatically detects support and resistance zones
- Multi-timeframe level analysis
- Displays higher timeframe zones on lower timeframe charts
- Supports breakout and reversal strategies
- Customizable calculation period
- Helps reduce manual chart analysis time
Best for
- Identifying important market reaction zones
- Planning breakout trading strategies
- Finding possible reversal areas
- Combining support and resistance with price action
- Analyzing market structure across multiple timeframes
Best Markets
- EUR/USD and GBP/USD where technical levels are frequently respected
- USD/JPY for identifying major reaction zones during trends
- Gold (XAU/USD) where psychological levels often influence price movement
- Major indices such as NAS100 and US30 with strong intraday ranges
- Commodity markets where support and resistance levels can guide longer moves
Trading Styles
- Scalping using short-term support and resistance reactions
- Intraday trading with M15 and H1 confirmation
- Swing trading based on H4 and Daily levels
- Breakout strategies after important zones are breached
- Price action trading using rejection candles and market patterns
How traders use it
The Support Resistance Indicator can be used for both reversal and continuation strategies.
When price approaches a support zone, users can watch for bullish confirmation such as rejection candles or momentum shifts.
When price reaches resistance, bearish price action may indicate a possible selling opportunity.
Another common method is trading breakouts.
Once price moves through a major support or resistance zone, the broken level can sometimes become a new area of interest.
A previous resistance level may act as support after a bullish breakout, while broken support may become future resistance.
Enhanced Strategy
For stronger entry confirmation, this tool can be combined with an oscillator such as the Schaff Trend Cycle Indicator for MT4.
For example, when price reaches a support zone and the Schaff Trend Cycle moves above the 25 level after leaving oversold conditions, it can provide additional confirmation that buying momentum is returning.
A possible BUY setup could occur when price reacts from a support zone, the oscillator crosses upward from the oversold area, and the next candle closes above the previous signal candle’s high.
For SELL setups, traders can monitor resistance reactions combined with a downward oscillator crossover from the 75 level and bearish price confirmation.
Many experienced users first identify the main direction on the H4 or Daily chart and then use lower timeframes such as M15 or H1 to refine entries.
This approach can help avoid taking trades against the dominant market movement.
Get Instant Free Access
Indicator Settings
- Period: Defines the calculation period used to identify support and resistance zones. A higher value can focus on broader market levels, while a lower value may highlight more recent price areas.
- Mode: Controls how support and resistance levels are displayed. Consolidated mode combines nearby zones into cleaner areas, while unconsolidated mode displays individual levels separately.
Important Notes
- Support and resistance zones should be confirmed with price action before entering trades.
- Higher timeframe levels usually carry more importance than short-term zones.
- Strong market momentum can break through support and resistance areas without immediate reactions.
- Combining this tool with oscillators or trend analysis can improve trade filtering.
- The indicator is designed as an analysis aid and should be used with proper risk management.









